

If you run a business, agency, or sales team, you already feel CAC in your gut. You see ad invoices, payroll, and tool subscriptions… but it is hard to answer one deceptively simple question: what does a single new customer really cost?A CAC calculator in Google Sheets or Excel pulls those moving parts into one living model. Marketing can plug in ad spend, sales logs new customers, finance adds overhead, and everyone sees the same number instead of debating screenshots.Now layer in an AI computer agent. Instead of someone babysitting tabs and copying exports, the agent logs into your CRM, ad platforms, and email, moves the data into Sheets or Excel, applies your CAC formula, checks for anomalies, and refreshes reports on a schedule. You are no longer chasing numbers; you are reacting to them in real time, with a quiet digital teammate doing the grunt work for you.
Customer Acquisition Cost (CAC) is one of those metrics that quietly runs the show. If you get it wrong, you overspend on campaigns that feel good but bleed cash. If you get it right, you can scale with confidence.Below are practical ways to calculate CAC manually in Google Sheets and Excel, and then how to scale the same workflow with an AI computer agent so you never have to rebuild it by hand again.## 1. Manual CAC Calculation in Google Sheets**Step 1: List your acquisition costs**1. Open a new Sheet.2. In column A, list all cost categories: Ad spend, sales salaries, marketing tools, freelancers, events, etc.3. In column B, enter the cost for the chosen period (for example, last month).4. At the bottom of column B, add a SUM formula: `=SUM(B2:B20)` and label it `Total Acquisition Cost`.**Step 2: Track new customers**1. In a separate tab (or column D), create a simple table with Date and New Customers.2. Either type the count manually from your CRM, or paste an export and use `=SUM(D2:D31)` for monthly new customers.**Step 3: Calculate CAC**1. In a summary cell, add: `=Total_Acquisition_Cost / New_Customers` (or reference the exact cells, e.g., `=B21/F5`).2. Format as currency and label it clearly: `CAC - This Month`.**
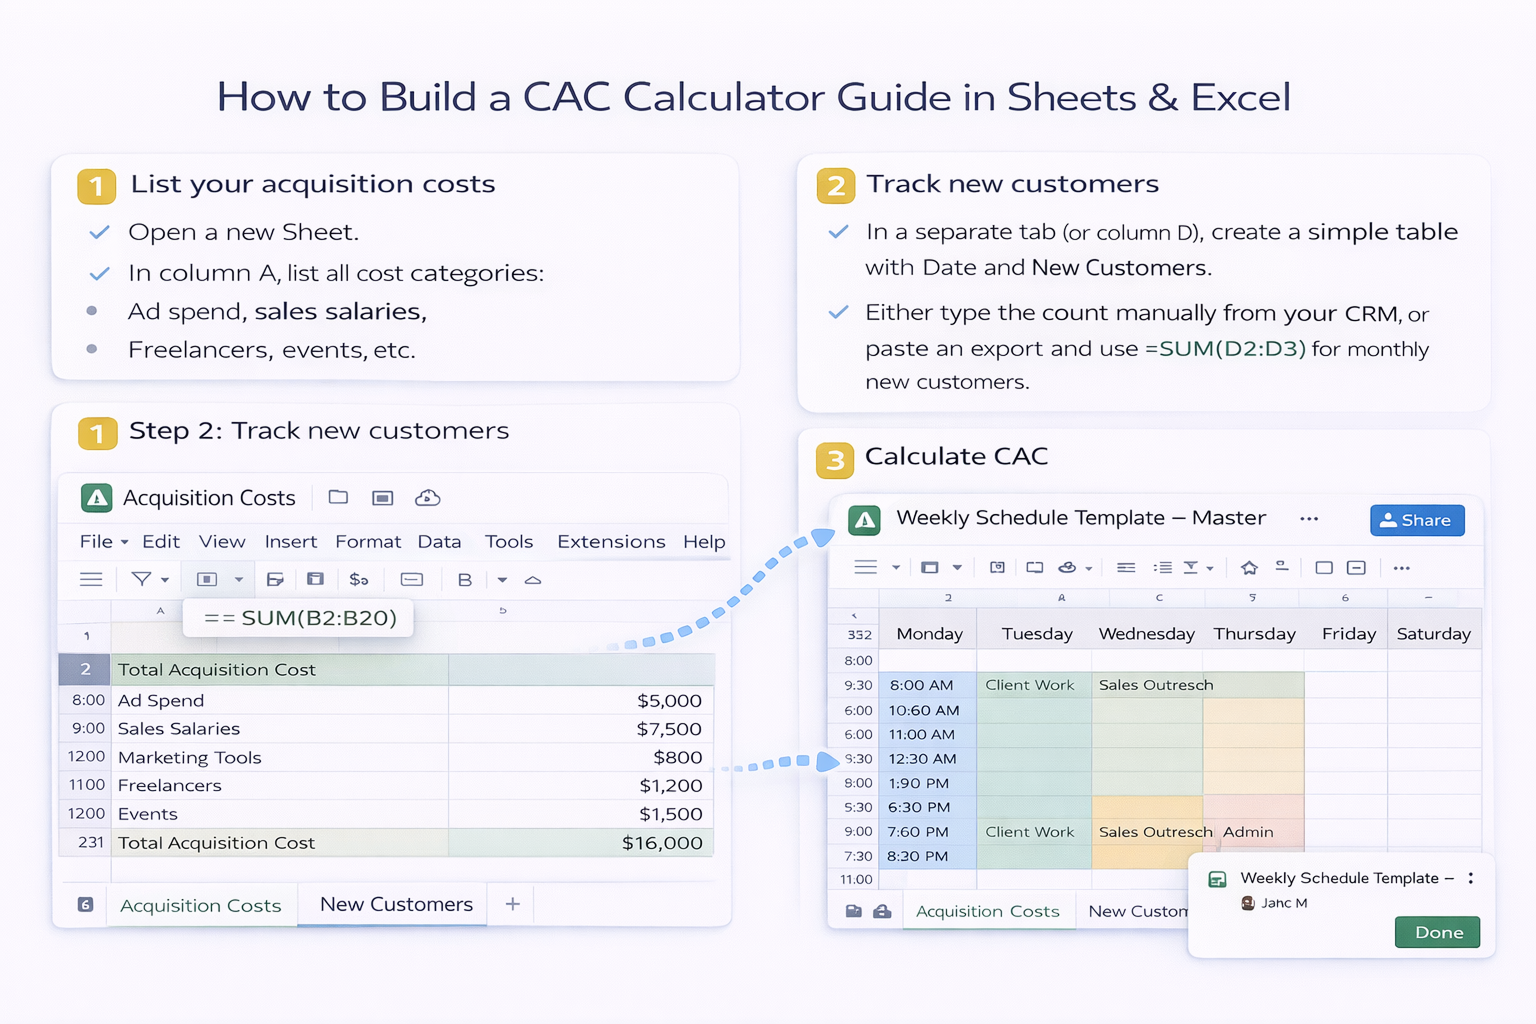
Pros of manual Google Sheets**- Very flexible and easy to tweak.- Great for early-stage teams or one-off analysis.- Collaboration and comments are simple.**Cons**- Relies on someone updating the inputs every week or month.- Prone to copy-paste errors and broken formulas.- Does not scale well when you add more channels and regions.## 2. Manual CAC Calculation in ExcelExcel shines when your finance team lives in it and wants more structure.**Step 1: Build a cost table with structured references**1. Create a table named `Acquisition_Costs` with columns: Category, Amount, Period.2. Use `=SUMIFS(Acquisition_Costs[Amount], Acquisition_Costs[Period], "2025-01")` to get the cost for a specific month.**Step 2: Build a customers table**1. Create another table named `New_Customers` with columns: Date, Count.2. Use `=SUMIFS(New_Customers[Count], New_Customers[Date], ">=" & StartDate, New_Customers[Date], "<=" & EndDate)` to aggregate customers for the period.**Step 3: Add a clean CAC summary sheet**1. On a new sheet, use input cells for StartDate and EndDate.2. Reference the SUMIFS formulas to compute `Total Cost` and `New Customers`.3. Add `=Total_Cost / New_Customers` for CAC, plus a simple chart to show CAC trend by month.**Pros of manual Excel**- Strong structure with tables and named ranges.- Works well with existing finance models and offline workflows.- Powerful for scenario analysis.**Cons**- Still manual: exports, imports, and data cleaning take time.- Harder for non-finance teammates to adjust safely.- Version chaos if files are emailed around.## 3. Where Manual Starts To BreakManual CAC spreadsheets are fine when you have one or two ad platforms and a single sales motion. But as soon as you:- Add more channels (Meta, Google, LinkedIn, offline events).- Sell into multiple regions or segments.- Need weekly or even daily CAC updates.…someone on your team quietly becomes the "spreadsheet operator" instead of doing strategy. They log into five tools, export CSVs, clean columns, paste into Sheets or Excel, and pray no formulas break.That is exactly the type of repetitive, rules-based work an AI computer agent is built to own.## 4. Automating CAC With an AI Computer AgentAn AI agent running on your desktop can behave like a focused digital analyst that never gets tired.**What the agent can do for CAC**- Open your browser, log into ad platforms, and download spend reports.- Log into your CRM to pull new-customer counts for the same date range.- Clean column names, formats, and date ranges so they match your template.- Open Google Sheets or Excel, paste the data into the right tabs, and refresh formulas and charts.- Save, log results, and even email or Slack the updated CAC dashboard to your team.### Pros of AI-driven CAC automation- **Time back:** hours per week reclaimed from mindless exports and formatting.- **Consistency:** the AI follows the same clicks and steps every time, reducing human error.- **Transparency:** with a computer-use agent, you can see the exact actions it takes and adjust them.- **Scalability:** add more channels, markets, and product lines without multiplying manual workload.### Cons and considerations- **Initial setup:** you still need to design a solid CAC template and define clear steps for the agent.- **Change management:** when your tools or URLs change, you will need to retrain or update the workflow.- **Oversight:** someone should periodically spot-check numbers, just like you would with a human analyst.## 5. A Hybrid Approach That Works in the Real WorldMost teams get the best results by starting manually and then handing off the repetitive part to an AI agent.1. Use Google Sheets or Excel to design a CAC model that everyone trusts.2. Document the exact steps a human takes to refresh it: which tools they open, which filters they set, where they paste data.3. Train an AI computer agent to mimic those steps on your desktop or browser.4. Let the agent run on a schedule, while your marketers and sales leaders focus on interpreting the trends, not building them.CAC stops being a mystery number you calculate once a quarter. It becomes a living signal that updates itself and tells you, in near real time, whether your growth engine is healthy or burning cash.
Start by choosing a period, such as last month. In Google Sheets or Excel, list all acquisition costs (ads, sales salaries, tools, agencies) in one column and their amounts in the next. Sum them to get total acquisition cost. In another cell, enter the number of new customers for that period from your CRM. Finally, divide total cost by new customers. Label cells clearly so anyone on your team can audit or adjust assumptions.
Match your update cadence to how quickly your channels change. Most startups refresh CAC monthly so they can compare to revenue and runway. Performance-heavy teams may update weekly to catch bad campaigns early. If you are exporting data, block 30–60 minutes on the same day each cycle. With an AI agent, schedule updates automatically and review a summary instead of manually touching the spreadsheet every time.
Add a Channel column to your CAC sheet. Instead of one lumped cost, break spend by channel (Meta, Google Ads, LinkedIn, events, email tools). Pull new-customer counts by first-touch or last-touch source from your CRM. Use SUMIFS in Sheets or Excel to sum costs and customers per channel, then create a CAC formula for each. Visualize it as a bar chart so your team instantly sees which channels are efficient and which deserve a pause or test budget.
Compare CAC to Customer Lifetime Value (LTV) and payback period. As a rough rule, LTV should be at least 3x CAC. In your spreadsheet, estimate LTV using average revenue per customer and churn. Then compute CAC payback by dividing CAC by average monthly gross margin per customer. If payback is over 18–24 months, you may be scaling too aggressively. Use these signals to adjust bids, cut weak channels, or double down on high-retention segments.
An AI computer agent can log into your ad platforms and CRM, export the latest reports, clean column names and dates, and paste them into the correct tabs in Google Sheets or Excel. It can then trigger recalculation, check for missing values, and flag anomalies such as zero customers with non-zero spend. Instead of a human repeating those clicks weekly, you review the updated dashboard and investigate outliers, dramatically reducing error risk and manual effort.