
로보비서(Robosecretary)란 무엇인가? 다수의 자율형 컴퓨터를 운용하는 컴퓨터 사용 에이전트
캘리포니아주 팔로알토 • 2026년 9월
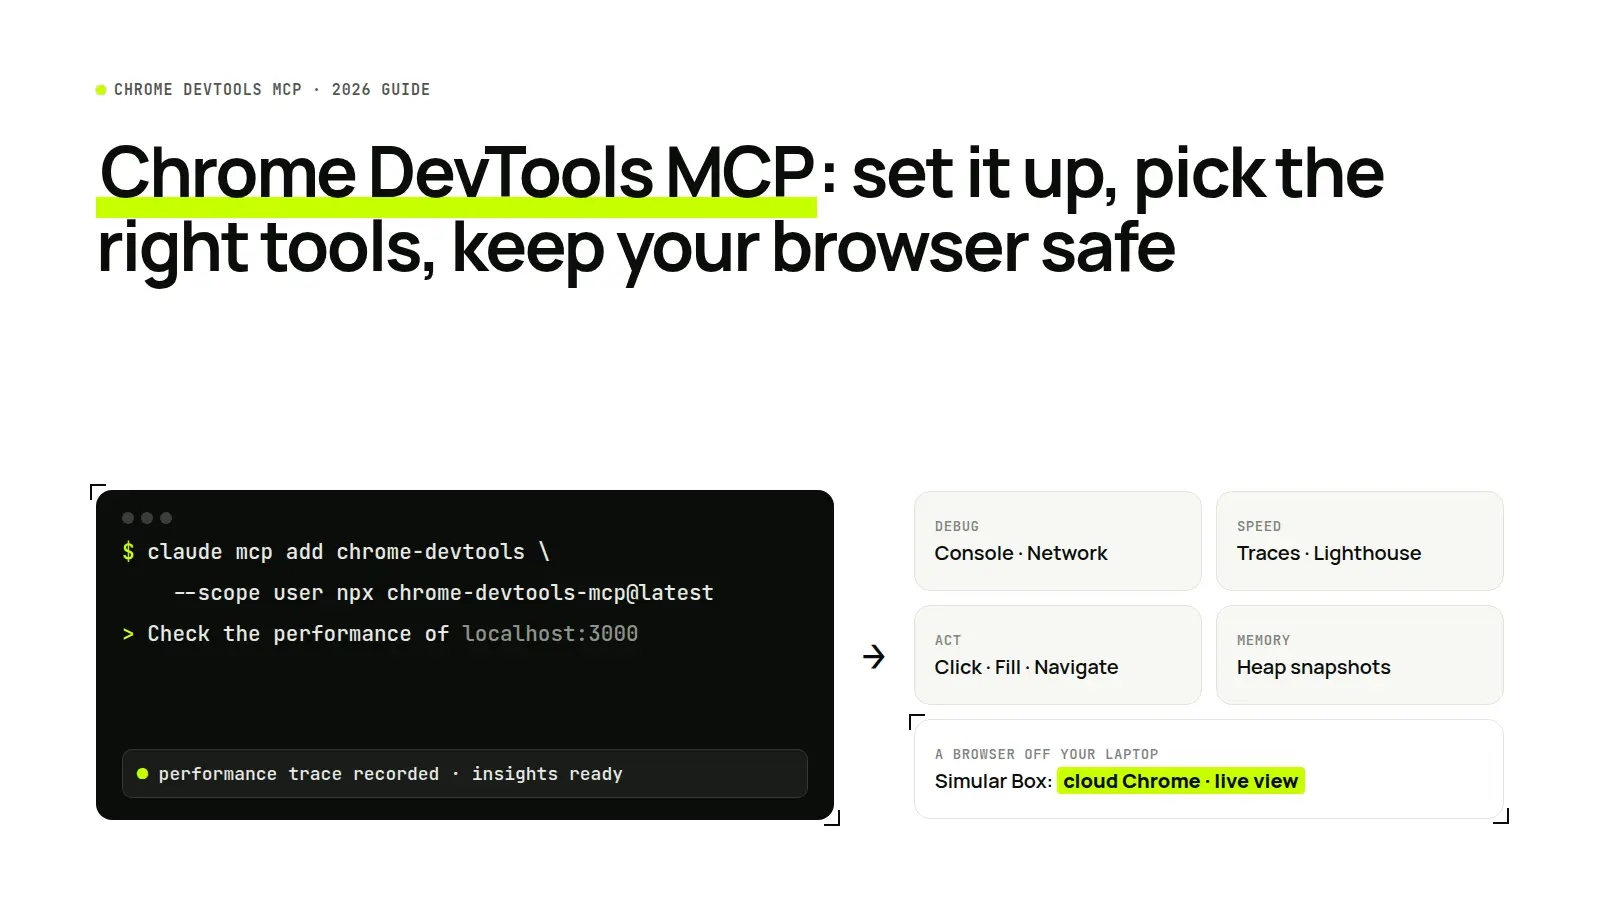
Short answer: Chrome DevTools MCP (chrome-devtools-mcp) is the Chrome DevTools team's official MCP server. It lets a coding agent such as Claude Code, Codex, Cursor, Copilot or Gemini CLI control and inspect a live Chrome browser: click and type, read console errors, inspect network requests, record performance traces and run Lighthouse audits. Add it to your agent with one command, then ask something like "Check the performance of localhost:3000". It drives a Chrome on the same machine as the agent. If you want the agent to work in a separate browser that stays signed in and that you can watch from anywhere, give it a cloud computer such as Simular Box.
What is Chrome DevTools MCP?
Chrome DevTools MCP is an open-source Model Context Protocol server, published by the Chrome DevTools team, that gives an AI coding agent the power of Chrome DevTools. Google announced it in public preview on September 23, 2025. The GitHub repository is Apache-2.0 licensed and had about 57,000 stars on November 15, 2026, with version 1.13.0 as the latest release.
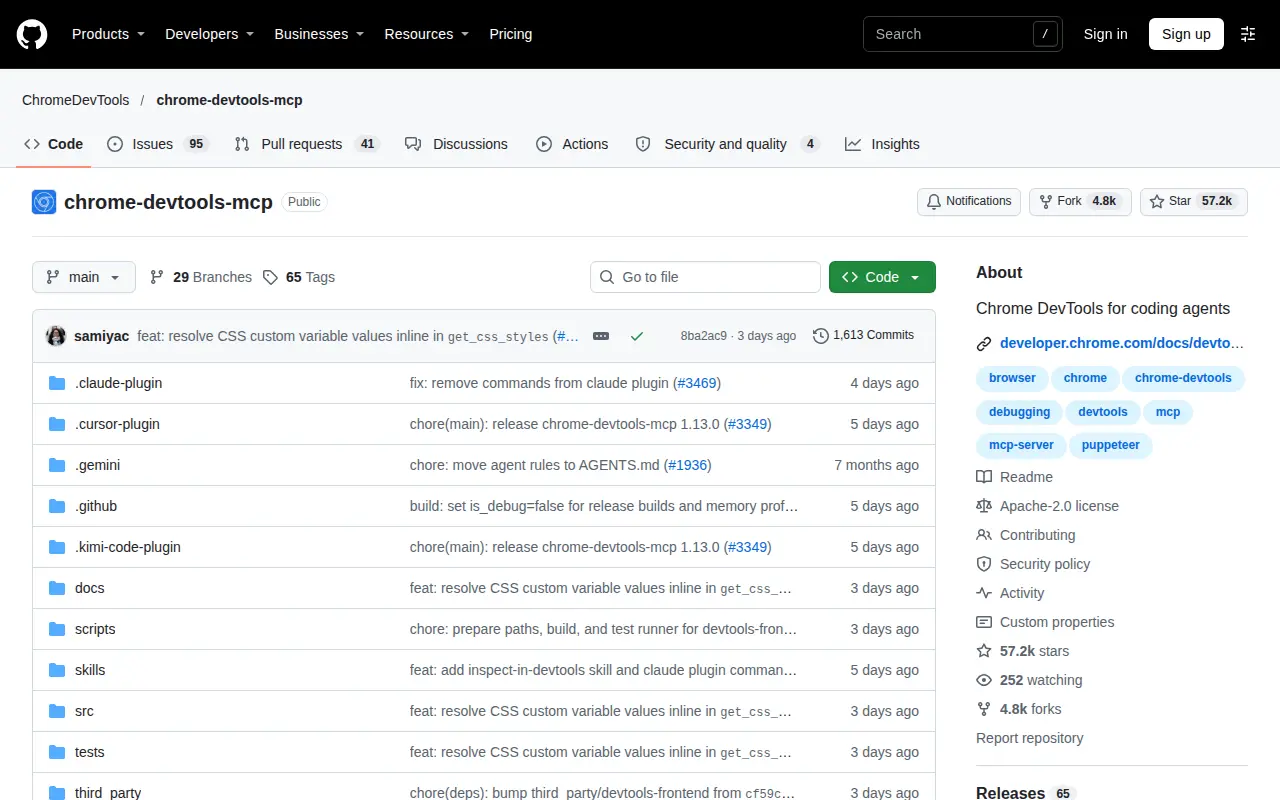
Without it, a coding agent edits your front end and guesses what the browser does. With it, the agent opens the page, sees the console and network traffic, and checks its own work. The package ships as an MCP server and as a chrome-devtools command-line tool, plus skills that teach agents how to use it.
How Chrome DevTools MCP works
The server uses Puppeteer and the Chrome DevTools Protocol to drive Chrome. Your agent calls a tool, the server performs the action in Chrome and waits for the result, and the agent reads what came back. The server starts Chrome the first time a tool needs it.
It can reach Chrome in four ways:
| Mode | How to turn it on | What the agent sees |
|---|---|---|
| Dedicated profile (default) | No flag | A Chrome with its own profile, kept between runs |
| Isolated | --isolated | A temporary profile, deleted when the browser closes |
| Connect to a running Chrome | --browser-url=http://127.0.0.1:9222 | A Chrome you started with a remote debugging port |
| Auto-connect to your Chrome | --autoConnect | Your own open Chrome (Chrome 144 or later), after you allow it |
Auto-connect arrived in December 2025. You first turn on remote debugging at chrome://inspect/#remote-debugging, and Chrome asks for your permission each time the server requests a session. It lets an agent fix a bug behind a sign-in without signing in again, but it also gives the agent everything open in that profile.
How to set up Chrome DevTools MCP
You need a current Node.js LTS release and Chrome stable or newer. Add the server to your agent:
# Claude Code (all projects)
claude mcp add chrome-devtools --scope user npx chrome-devtools-mcp@latest

# Codex
codex mcp add chrome-devtools -- npx chrome-devtools-mcp@latest

# Gemini CLI
gemini mcp add -s user chrome-devtools npx chrome-devtools-mcp@latest
For Cursor, VS Code, Copilot and other clients, add the standard config in the client's MCP settings:
{
  "mcpServers": {
    "chrome-devtools": {
      "command": "npx",
      "args": ["-y", "chrome-devtools-mcp@latest"]
    }
  }
}
In Claude Code you can also install it as a plugin, which adds the server and its skills: run /plugin marketplace add ChromeDevTools/chrome-devtools-mcp, then /plugin install chrome-devtools-mcp@chrome-devtools-plugins. The client configuration guide covers every supported client.
Test it. Start a new session and ask: "Check the performance of https://developers.chrome.com". The agent should open Chrome and record a performance trace.
What Chrome DevTools MCP can do
The tool reference groups the tools by job:
| Group | Example tools | Use it to |
|---|---|---|
| Input automation | click, fill, fill_form, upload_file | Act on a page like a user |
| Navigation | new_page, navigate_page, wait_for | Open and switch pages |
| Debugging | list_console_messages, evaluate_script, take_snapshot, lighthouse_audit | Read errors, inspect the DOM, audit a page |
| Network | list_network_requests, get_network_request | Find failing or slow requests |
| Performance | performance_start_trace, performance_analyze_insight | Record traces and explain slow loads |
| Emulation | emulate, resize_page | Test mobile sizes, slow networks and CPU |
| Memory | take_heapsnapshot, compare_heapsnapshots | Find memory leaks |
More groups cover network mocks, extensions, WebMCP, progressive web apps and WebAuthn. Each group can be switched off with a category flag, and --slim exposes a small set of tools for basic browsing, which saves context.
Prompts to try:
- "Open localhost:3000, submit the sign-up form with test data and tell me which console errors appear."
- "Record a performance trace of the home page and explain what slows down Largest Contentful Paint."
- "List the network requests that fail on the checkout page and show the response bodies."
Flags worth knowing
| Flag | What it does |
|---|---|
--headless | Runs Chrome without a window |
--isolated | Uses a temporary profile that is deleted afterwards |
--slim | Exposes a reduced set of tools |
--browser-url | Connects to a Chrome you started with remote debugging |
--autoConnect | Connects to your open Chrome after you allow it |
--channel | Picks Chrome stable, beta, dev or canary |
--no-usage-statistics | Turns off Google's usage statistics |
--no-performance-crux | Stops sending trace URLs to the CrUX API |
The full list is in the configuration guide.
Privacy and safety
- The agent sees the whole browser. The README warns that the server "exposes content of the browser instance to the MCP clients". Keep it on test accounts and development data, and prefer
--isolatedor a separate profile over your everyday Chrome. - Usage statistics are on by default. Google collects tool success rates, latency and environment details; pass
--no-usage-statisticsto opt out. - Performance tools can call CrUX. Trace URLs may be sent to the Chrome UX Report API for field data; pass
--no-performance-cruxto stop it.
Troubleshooting Chrome DevTools MCP
| Problem | Likely cause | Fix |
|---|---|---|
| Chrome fails to start in a container | Chrome does not run as root | Run the server as a non-root user |
| Chrome will not start inside a sandboxed MCP client | The client's sandbox blocks Chrome's own sandbox | Turn off sandboxing for this server, or start Chrome yourself and use --browser-url |
| Connection refused from a VM to the host's Chrome | Chrome rejects the Host header | Tunnel the port over SSH, then point --browser-url at http://127.0.0.1:9222 |
--autoConnect cannot find DevToolsActivePort on macOS | Remote debugging is off or blocked | Turn it on at chrome://inspect/#remote-debugging and allow the request |
| Tools do not appear | The session started before the server was added | Restart the agent and check its MCP list |
More fixes are in the official troubleshooting guide.
Chrome DevTools MCP vs Playwright MCP vs a cloud browser
| Chrome DevTools MCP | Playwright MCP | A cloud computer such as Simular Box | |
|---|---|---|---|
| Made for | Debugging and performance work in Chrome | Cross-browser automation and tests | Giving your AI its own browser and desktop |
| Where the browser runs | On the agent's machine | On the agent's machine | In the cloud |
| Browsers | Chrome | Chromium, Firefox, WebKit | Chrome on Ubuntu |
| Logins | Its own profile, or your Chrome with auto-connect | Its own profile | Chrome on the box stays signed in |
| A person can watch and take over | In the local window | In the local window | Live view from anywhere, with take control |
| Works in Claude or ChatGPT chat | No (local process) | No (local process) | Yes, as a remote MCP server |
Pick Chrome DevTools MCP when the job is fixing your own front end: console errors, failing requests, slow pages. Pick Playwright MCP for cross-browser automation. For more options, see our list of best computer use MCP servers.
When to give the agent its own browser instead
Chrome DevTools MCP shares a machine with your agent, and with auto-connect it shares your own Chrome. That is right for local debugging. It is the wrong fit when the agent should work on its own for a while: a long research task, a check of your staging site behind a login, or a job you want to hand from Claude Code to Codex.
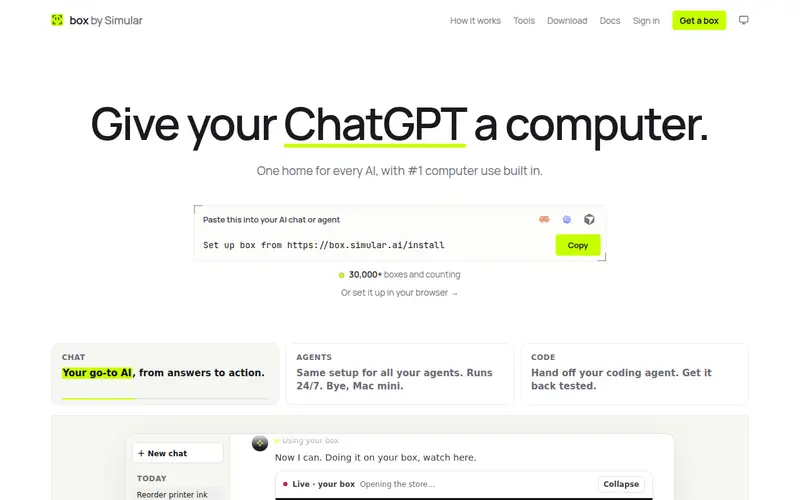
Simular Box (box by Simular) gives the AI you already use its own cloud computer: an Ubuntu desktop with Chrome, files and a terminal, reached as one remote MCP server. Your own Chrome stays free while the agent works.
- Its own Chrome, still signed in. Sites you sign in to on the box stay signed in for the next task, and your passwords are never sent to the AI.
- Watch and take over. The live view shows the screen as the agent works, and you take control for a password or 2FA code, then hand it back.
- Hand work between agents. Claude Code can open your preview in the box's Chrome, and Codex or ChatGPT can pick up the same session later; agents take turns on a box.
- Works in chat apps too. Claude and ChatGPT can use the same box, which a local MCP server cannot offer. In ChatGPT, search for box by Simular in Plugins and install it in one click.
Setup for each app is in the box docs. Pricing starts with $5 of free credit. For more on the trade-off, read MCP server for computer use and compare hosted options in best cloud browsers for AI agents.
FAQ
Is Chrome DevTools MCP free?
Yes. It is open source under the Apache-2.0 licence and runs with your own Chrome. You pay only for the AI model your agent uses.
Does Chrome DevTools MCP work with Claude Code, Codex and Cursor?
Yes. It works with Claude Code, Codex, Cursor, VS Code with Copilot, Gemini CLI, Antigravity and other MCP clients. Claude Code and Gemini CLI can also install it as a plugin or extension with its skills.
Can Chrome DevTools MCP use my signed-in Chrome?
Yes, with --autoConnect and Chrome 144 or later. Turn on remote debugging at chrome://inspect/#remote-debugging; Chrome asks for permission each time. The agent then sees everything open in that profile, so use it with care.
Does Google collect data from Chrome DevTools MCP?
Usage statistics such as tool success rates and latency are collected by default. Start the server with --no-usage-statistics, or set the CHROME_DEVTOOLS_MCP_NO_USAGE_STATISTICS environment variable, to opt out.
What is the difference between Chrome DevTools MCP and Playwright MCP?
Chrome DevTools MCP is built for debugging Chrome: console, network, performance traces, memory and Lighthouse. Playwright MCP is built for automation across Chromium, Firefox and WebKit.
Can Chrome DevTools MCP run headless?
Yes. Add --headless to the server's arguments. Use --isolated as well if you want a clean, temporary profile for each run.
Sources
- ChromeDevTools/chrome-devtools-mcp on GitHub, including the tool reference, configuration, advanced usage and troubleshooting guides
- Chrome for Developers: Chrome DevTools (MCP) for your AI agent
- Chrome for Developers: Let your coding agent debug your browser session
- Playwright MCP
- Simular Box docs
Commands, flags and tools were checked against the chrome-devtools-mcp repository on November 15, 2026.
