
Oops! Something went wrong while submitting the form.

.svg)
Hidden rows feel harmless—until the quarter‑end report is off, a lead list is missing 20% of prospects, or a client asks why the numbers don’t match their CRM. In Google Sheets, rows disappear for all kinds of reasons: filters, grouping, manual hiding, or scripts someone set up months ago and forgot about. Knowing how to unhide rows is basic spreadsheet literacy, but it’s also about data trust. If your team can’t reliably see all the rows that matter, every forecast, campaign report, or operations dashboard is quietly compromised.
That’s why it’s worth delegating the unglamorous work to an AI agent. Instead of sales reps and marketers hunting for tiny gray arrows and filter icons, an AI computer agent can patrol your Google Sheets, surface hidden rows, log what changed, and keep every view complete—so humans stay focused on strategy, not spreadsheet detective work.
It’s 8:45 a.m. Your client is on Zoom, waiting for an updated campaign report. You open the Google Sheet and your conversion numbers look strangely low. You double‑check formulas, refresh Looker Studio, even blame the tracking pixel—until you notice it: row numbers jumping from 72 to 89. Half the campaign rows are simply hidden.
If that sounds familiar, you’re not alone. Hidden rows are great for keeping spreadsheets tidy, but they quietly break dashboards, reports, and hand‑offs. The good news: unhiding rows is simple, and with an AI agent like Simular you can automate the boring parts at scale.
Below are the top ways to unhide rows in Google Sheets—from quick manual fixes to fully automated AI workflows.
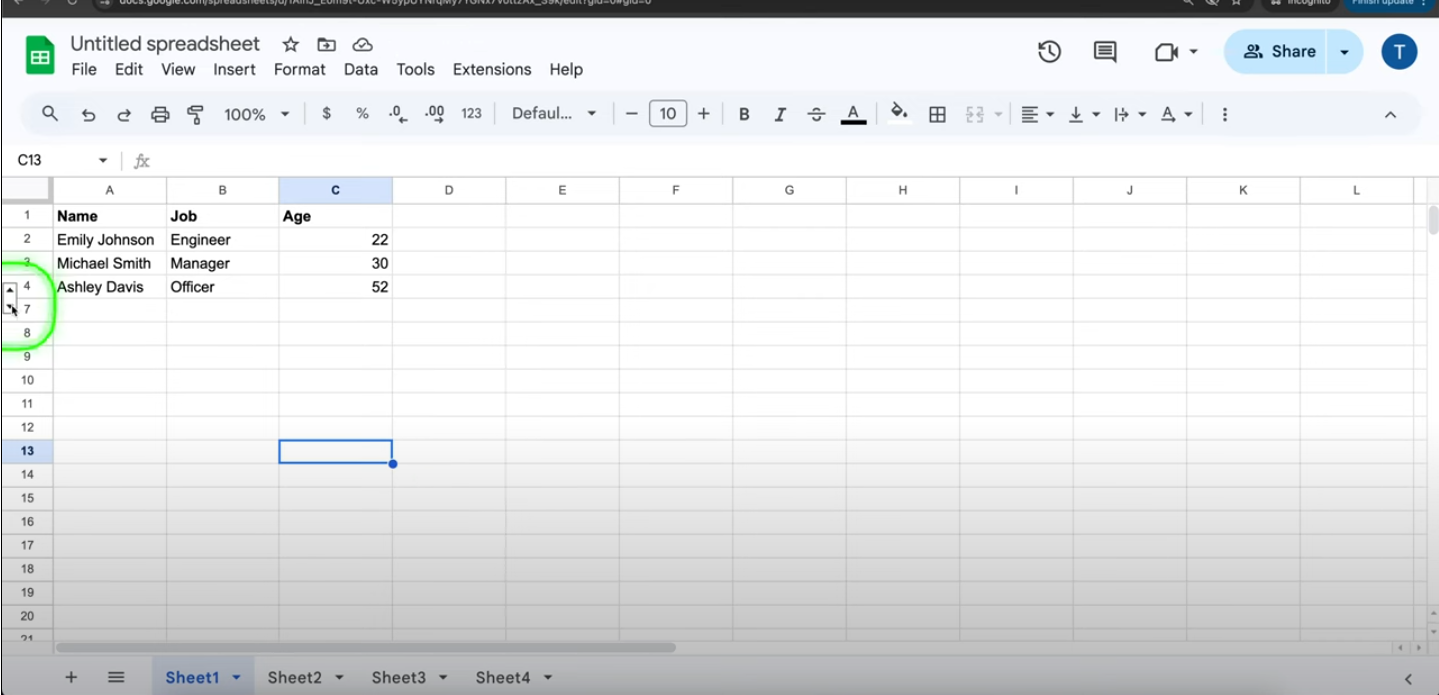
Google Sheets shows hidden rows as a gap in numbering (e.g., 5 jumps to 9) with small up/down arrows next to the gap.
Steps:
Best for: One‑off fixes when you already know roughly where the missing data lives.
Pros:
Cons:
When you suspect several hidden sections, the right‑click method is more systematic.
Steps:
To unhide everything at once:
Pros:
Cons:
If you live in spreadsheets all day, shortcuts save minutes that add up quickly.
Steps:
Pros:
Cons:
Many teams use grouping so they can collapse sections (e.g., per‑client or per‑month blocks).
Steps:
Pros:
Cons:
Sometimes your rows aren’t “hidden,” they’re filtered out.
Steps:
Pros:
Cons:
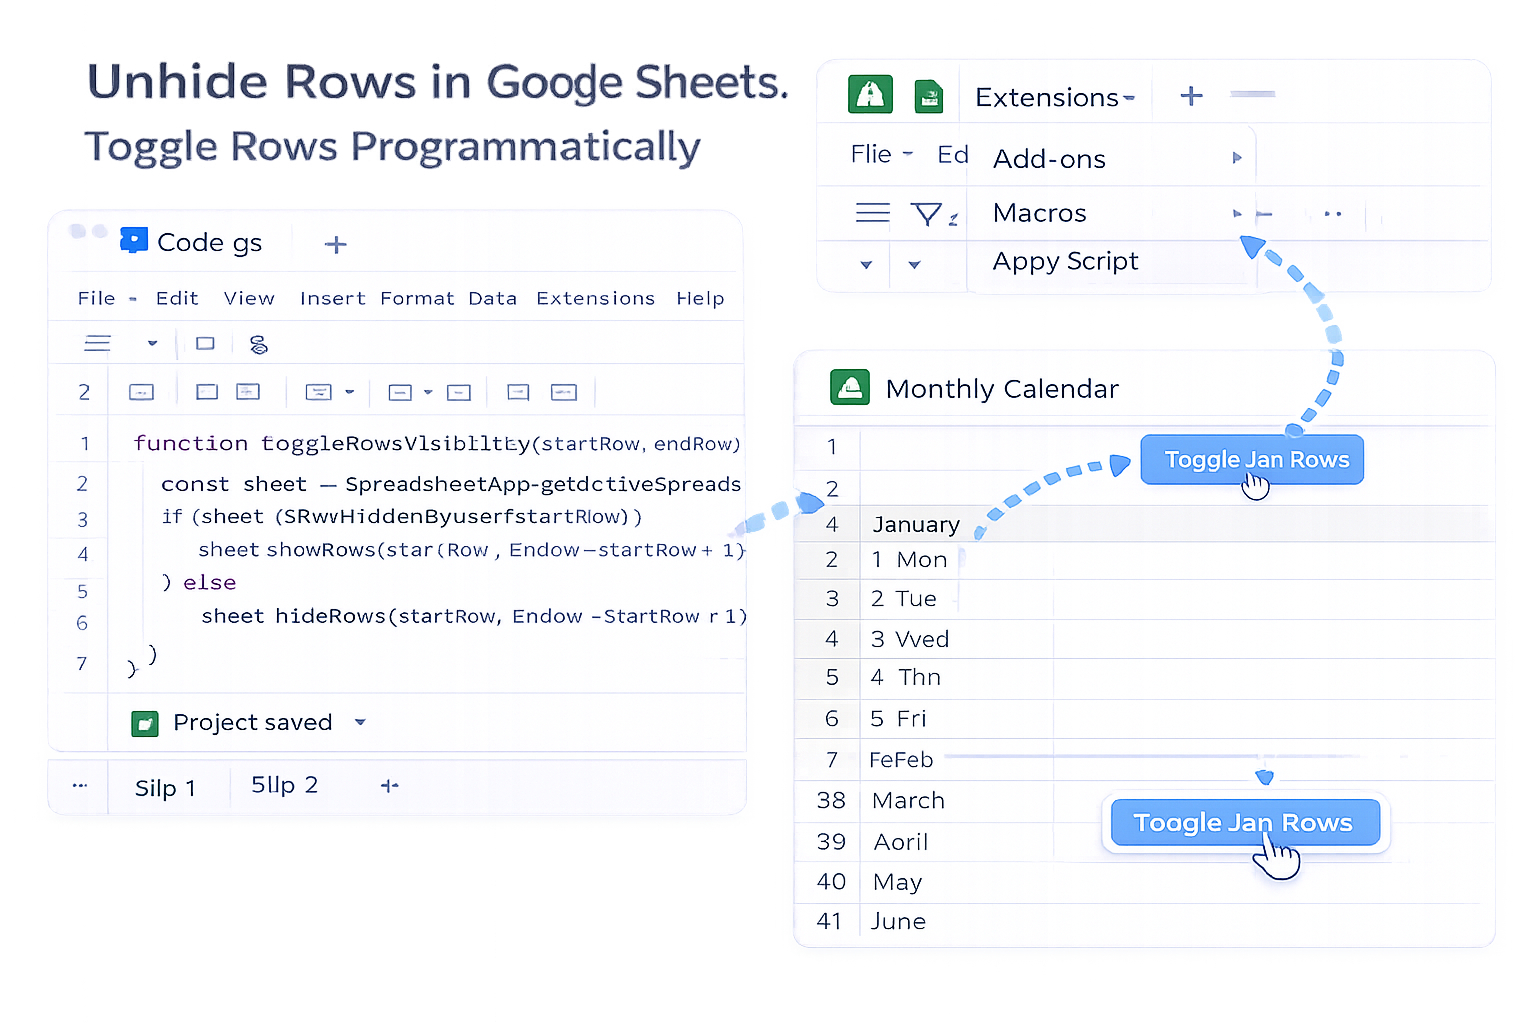
If you routinely show/hide the same ranges (e.g., months in a calendar sheet), simple Apps Script can help.
Example Script:
function toggleRowsVisibility(startRow, endRow) {
  const sheet = SpreadsheetApp.getActiveSpreadsheet().getActiveSheet();
  if (sheet.isRowHiddenByUser(startRow)) {
    sheet.showRows(startRow, endRow - startRow + 1);
  } else {
    sheet.hideRows(startRow, endRow - startRow + 1);
  }
}
How to use it:
Pros:
Cons:
Manual methods work—until you’re juggling dozens of Sheets, multiple clients, and a stack of tabs in Chrome. This is where an AI computer agent shines.
With Simular Pro, you can:
Example workflow for a marketing agency:
Pros:
Cons:
If you:
…then it’s time to delegate this to an AI agent. You keep the strategic brain; Simular handles the clicks.
Once configured, your Simular AI computer agent becomes the quiet spreadsheet guardian in the background—making sure every row that should be visible, is visible, every single time.

