
Oops! Something went wrong while submitting the form.

.svg)
A marketing reach calculator turns gut-feel campaigns into measurable, optimizable systems. Instead of guessing how many unique people saw your ads, you track impressions, frequency, and cost in one structured model. With Google Sheets you can centralize data from Meta, Google Ads, LinkedIn, and email, apply the classic reach formula (Reach = Impressions / Frequency), and instantly compare campaigns, creatives, and channels.
Now imagine delegating the grunt work to an AI computer agent. While you sleep, it logs in to ad platforms, exports performance, pastes everything into Google Sheets, refreshes pivot tables, and flags campaigns whose cost per reach is spiking. You wake up not to raw numbers, but to a living reach dashboard you didn’t have to build or maintain yourself.
Before we talk automation, it helps to understand the manual workflow you’re trying to offload.
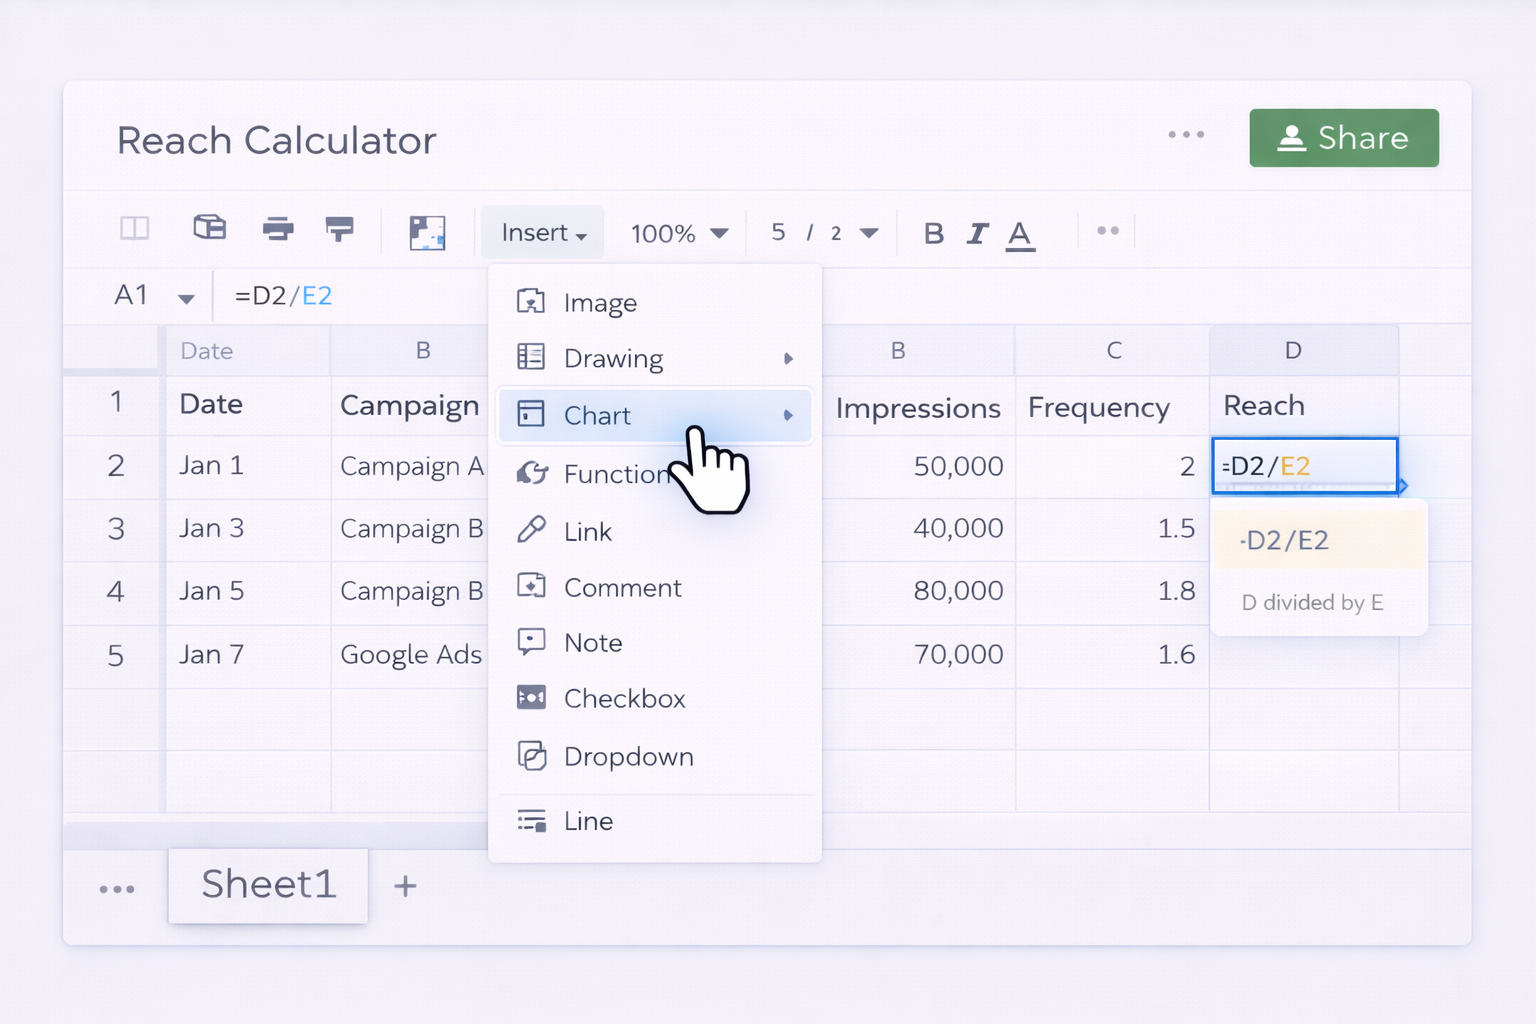
Date, Campaign, Channel, Impressions, Frequency, Reach.Reach column, use the basic formula:=D2/E2 assuming D is Impressions and E is Frequency.Insert → Chart to visualize reach trends.Official docs to help:
Spend, Cost_per_Reach.Spend column.Cost_per_Reach, use:=G2/F2 assuming G is Spend and F is Reach.Insert → Pivot table) to summarize reach and cost per reach by channel and by campaign.Docs:
If your platform does not give you frequency:
Freq_Assumed column and fill with that value.=Impressions / Freq_Assumed.
Manual pasting works for a couple of campaigns; it collapses when you manage dozens across channels. No‑code tools can move data into Google Sheets on a schedule.
Impressions, Average frequency (if available), Cost and identifiers like campaign and date.Reach (=Impressions / Frequency) and Cost_per_Reach.Docs:
Reach: =ARRAYFORMULA(IF(D2:D="",,D2:D/E2:E))Cost_per_Reach: =ARRAYFORMULA(IF(F2:F="",,G2:G/F2:F))Data → Protect sheets and ranges).Docs:
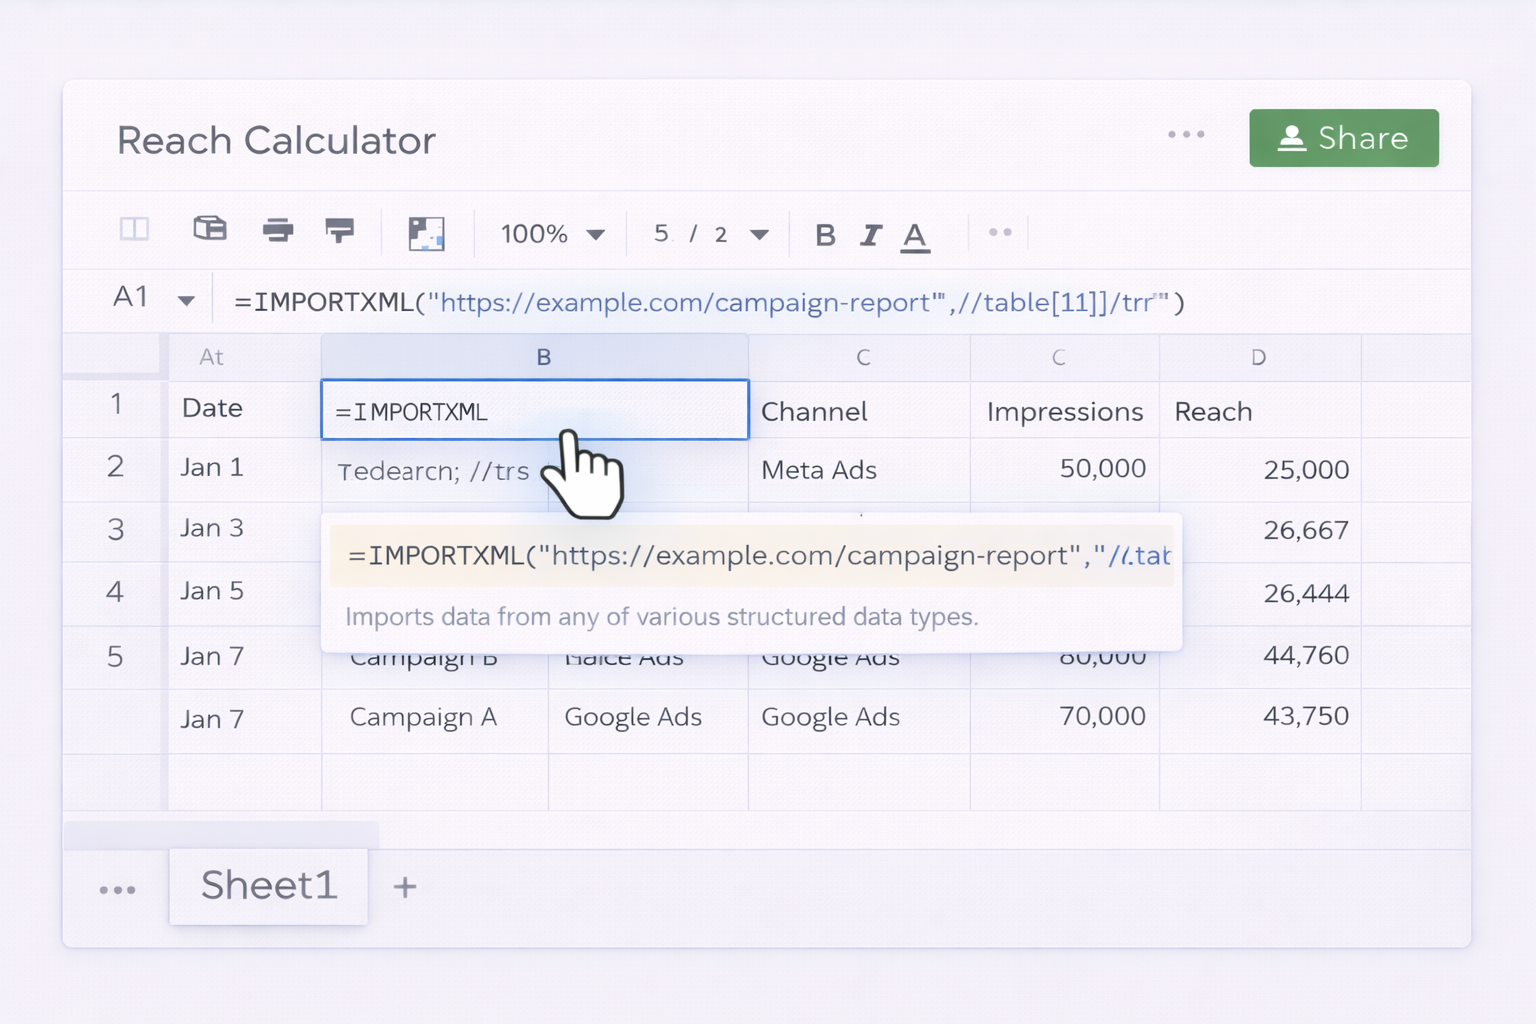
If you’re estimating reach from public stats (e.g., YouTube channel views as a proxy):
IMPORTXML or IMPORTHTML to fetch stats into Sheets.=IMPORTXML("https://example.com/campaign-report","//table[1]//tr").Docs:
At some point, even no‑code automation hits a wall: complex logins, 2FA, different report layouts per client, or channels that lack good APIs. This is where an AI computer agent that can actually use your desktop and browser shines.
What it does
How to set it up (conceptually):
Pros
Cons
What it does
Setup outline
Status column and an Alert rule in your Sheet (e.g., =IF(Cost_per_Reach>TARGET,"CHECK","OK")).Alert = CHECK, summarize them, and notify our sales/marketing channel.”Pros
Cons
