How to Build Google Sheets Pivots from Many Sheets

Guide to using Google Sheets pivot tables from multiple sheets, then handing updates to an AI computer agent so your reports refresh themselves while you sell.
Advanced computer use agent
Production-grade reliability
Transparent Execution

Why Google Sheets pivots + AI

Every owner, marketer, and agency lead knows the feeling: ten Google Sheets tabs, each with a slice of the truth—leads in one, ad spend in another, revenue in a third. Manually stitching them together for a weekly report steals an hour you should spend with clients or on strategy.A pivot table built from multiple sheets turns that chaos into a single, trustworthy dashboard. By standardizing headers and consolidating raw tables into one pivot-ready range, you can slice performance by channel, campaign, or rep in seconds instead of minutes.Now imagine delegating all of that prep to an AI computer agent. Instead of you hunting through tabs, a Simular agent opens Google Sheets, pulls in each source sheet, updates the QUERY range, refreshes the pivot, and even exports a clean summary. While it clicks, types, and checks totals with production-grade reliability, you simply open the finished view and decide what to do next.

How to Build Google Sheets Pivots from Many Sheets

### OverviewIf you’re a business owner, marketer, or agency lead, your reality probably looks like this: campaign results in one Google Sheets tab, CRM exports in another, product data in a third. Every week you wrestle them into a single pivot table to answer basic questions like “Which campaign drove the most pipeline by region?”In this guide, we’ll walk through:1. **Manual methods** to build a Google Sheets pivot table from multiple sheets.2. **No-code automation tools** that reduce repetitive work.3. **AI computer agent workflows with Simular** to handle this at scale, hands‑off.Throughout, refer to Google’s official docs:- Pivot tables basics: https://support.google.com/docs/answer/1272900- QUERY function: https://support.google.com/docs/answer/3093343- Pivot tables via API: https://developers.google.com/workspace/sheets/api/guides/pivot-tables---### 1. Traditional / Manual Ways#### Method 1: Copy everything into a single “Master” sheetThis is the simplest and most brittle approach, but great to understand the basics.
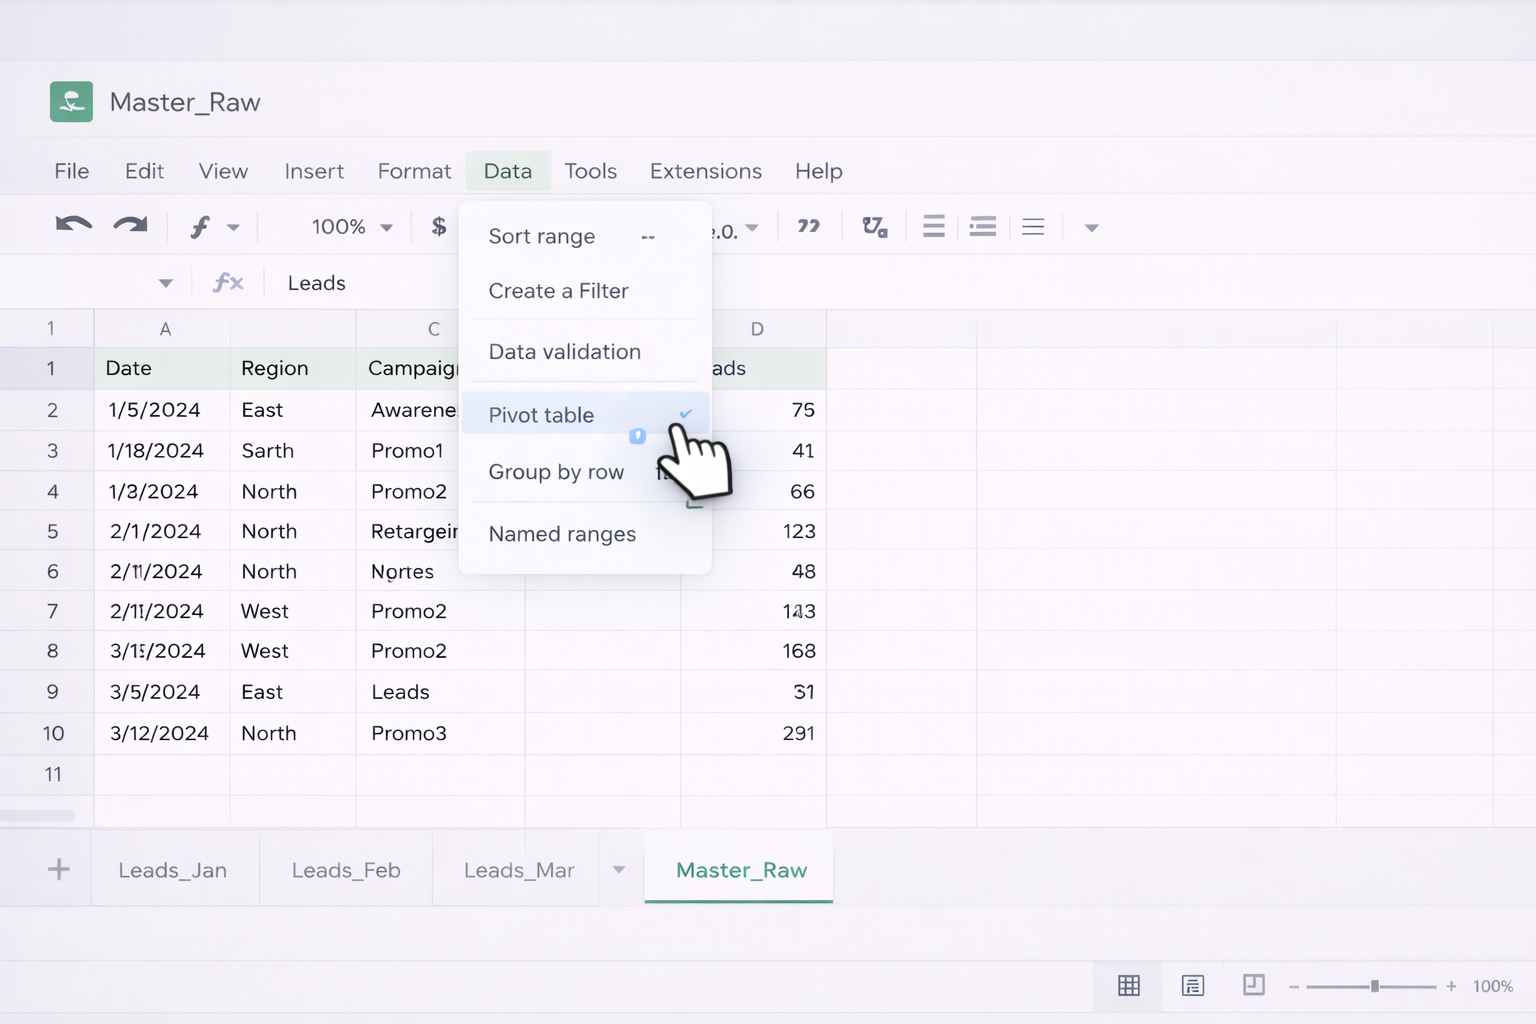
**Steps:**1. Open your spreadsheet in **Google Sheets**.2. Create a new sheet named `Master_Raw`.3. From each source tab (for example, `Leads_Jan`, `Leads_Feb`), select the entire data range, including headers.4. Paste the first sheet’s data into `Master_Raw!A1`.5. For each subsequent sheet, paste **below** the existing data, making sure the **column order and headers are identical**.6. Select the entire data region in `Master_Raw`.7. Go to **Data → Pivot table** and choose to place the pivot in a **new sheet**.8. In the pivot editor: - Add your dimension to **Rows** (for example, `Campaign` or `Region`). - Add your metrics to **Values** (for example, `Amount` as SUM, `Leads` as COUNTA).**Pros:**- Easy to understand.- No formulas required.**Cons:**- Must be repeated whenever new data arrives.- Error‑prone (duplicate rows, missed tabs).---#### Method 2: Use array literals to stack sheetsInstead of copy‑pasting, you can combine multiple sheets with a single formula.**Steps:**1. Create a sheet called `Combined`.2. In cell `A1`, enter something like: `={Leads_Jan!A1:F; Leads_Feb!A2:F; Leads_Mar!A2:F}` - The first range includes headers (`A1:F`). - Subsequent ranges skip the header row (`A2:F`).3. This formula vertically stacks all ranges. When you add new rows in those tabs, the `Combined` sheet updates automatically.4. Select the data in `Combined` and choose **Data → Pivot table**.5. Configure rows, columns, and values as needed.**Pros:**- No copy‑paste; updates as sources change.- Still simple and fully native to Google Sheets.**Cons:**- You must manually add each new sheet into the formula.- If columns don’t match, the array formula breaks.---#### Method 3: Combine sheets with QUERY`QUERY` gives you SQL‑like control and is ideal when you want to filter or reshape while merging.**Steps:**1. In a `Combined_Query` sheet, use: `=QUERY({Leads_Jan!A2:F; Leads_Feb!A2:F; Leads_Mar!A2:F},"SELECT * WHERE Col1 IS NOT NULL",1)`2. This stacks the three sheets and removes empty rows.3. Now create a pivot from `Combined_Query`: - Select the whole range (or use **Data → Pivot table**, letting Sheets detect it). - In **Rows**, add `Campaign` or `Source`. - In **Columns**, add `Month` or `Region`. - In **Values**, add your numeric metrics.4. As you add data to the source sheets, the QUERY result and pivot recalc automatically.For more on QUERY, see Google’s help center: https://support.google.com/docs/answer/3093343**Pros:**- Flexible filtering and shaping of raw data.- Single source of truth for pivots.**Cons:**- Formula is intimidating for non‑technical users.- Adding new sheets still requires editing the formula.---#### Method 4: Pull in external spreadsheets with IMPORTRANGEWhen your source data lives in different files, not just tabs, use `IMPORTRANGE`.**Steps:**1. In `Combined_Import`, use: `={IMPORTRANGE("spreadsheet_url_1","Leads_Jan!A2:F"); IMPORTRANGE("spreadsheet_url_2","Leads_Feb!A2:F")}`2. Authorize access when prompted.3. As with earlier methods, build your pivot from `Combined_Import`.**Pros:**- Lets you centralize data across teams or clients.**Cons:**- Cross‑file permissions must be managed.- Many IMPORTRANGEs can slow Sheets.For pivot basics again, see: https://support.google.com/docs/answer/1272900---### 2. No‑Code Automation MethodsManual work breaks down when:- You have dozens of clients or campaigns.- Data updates daily or hourly.- Non‑analysts need fresh dashboards without touching formulas.Here’s where no‑code tools shine.#### Method 5: Use a spreadsheet automation add‑onAdd‑ons like Coefficient can pull data from CRMs, ad platforms, and databases into Google Sheets on a schedule, ready for pivoting.**Workflow:**1. Install a Sheets add‑on from the Google Workspace Marketplace.2. Configure a data source (for example, Salesforce Opportunities or Google Ads campaigns) to load into a sheet like `Raw_CRM`.3. Set a refresh schedule (hourly/daily).4. Use one of the earlier combining methods (arrays/QUERY) if you still need to merge tabs.5. Build pivots on top of these always‑fresh raw tables.**Pros:**- Eliminates CSV exporting and manual pasting.- Non‑technical teammates can refresh data with a click.**Cons:**- Limited by each add‑on’s UI and data model.- Often per‑seat or per‑row pricing.#### Method 6: Connect tools like Zapier or MakeYou can route events (form submissions, CRM updates, ecommerce orders) directly into Sheets.**
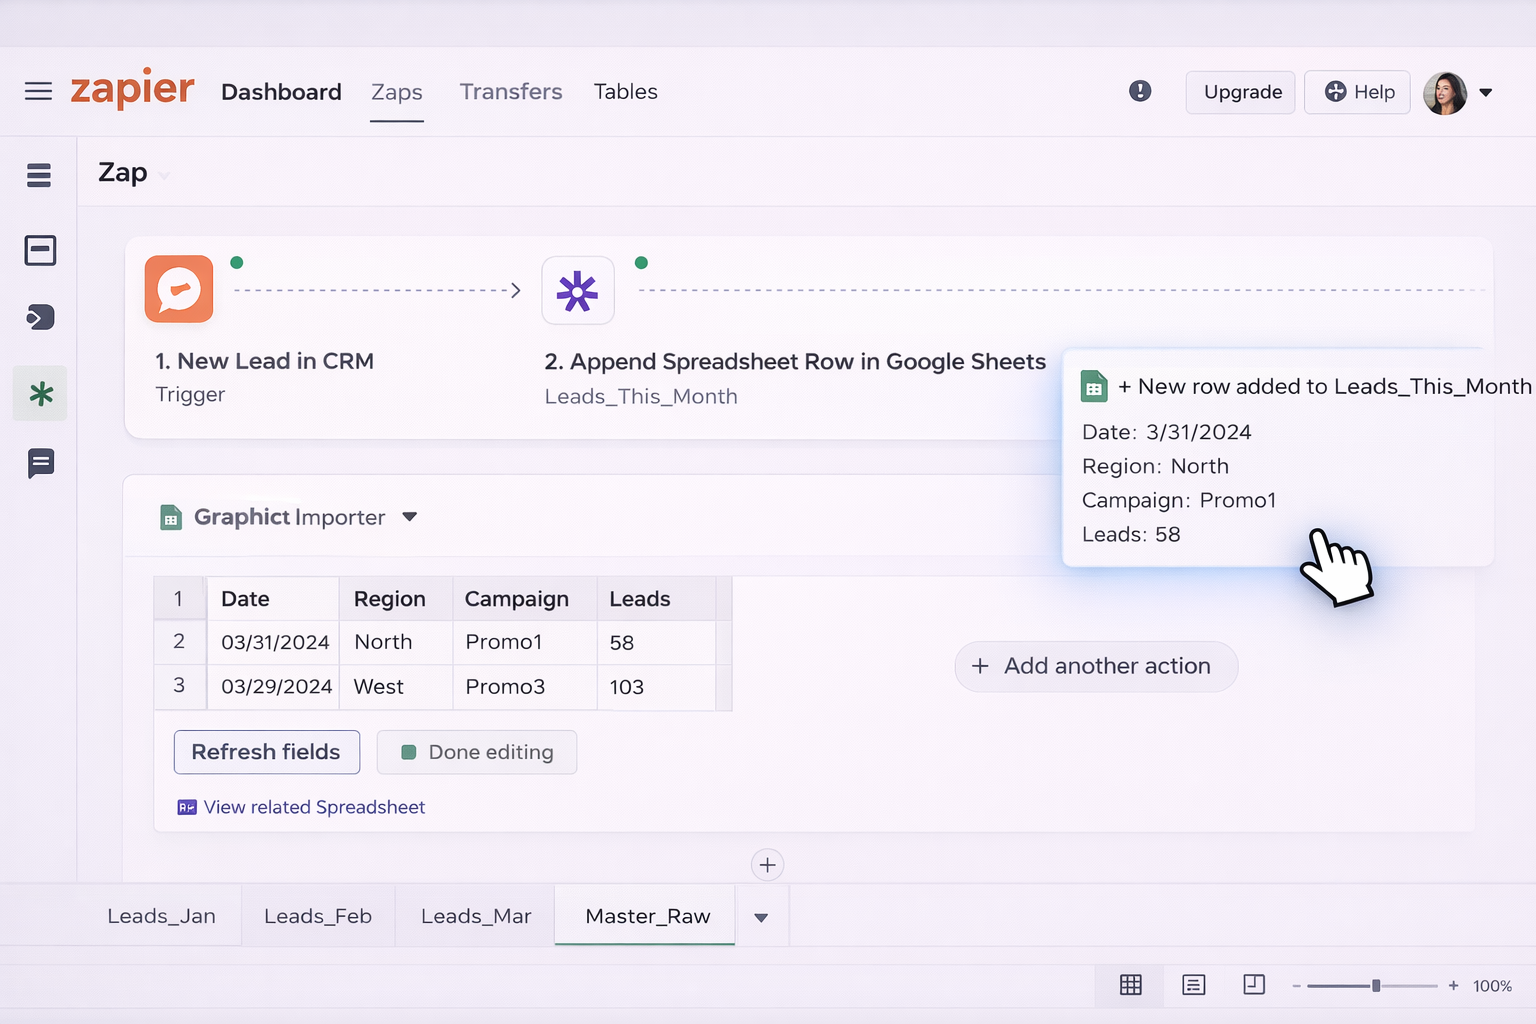
Workflow example for an agency:**1. Trigger: new lead in your CRM.2. Zapier/Make action: append a row to `Leads_This_Month` in Google Sheets.3. Use a `Combined` or `Combined_Query` sheet to merge monthly tabs.4. Your existing pivot table automatically reflects new leads.**Pros:**- Fully event‑driven; no one has to “update the sheet”.- Great for multi‑app workflows.**Cons:**- Logic is hidden inside each automation scenario.- Harder to debug than a simple formula.---### 3. At‑Scale Automation with an AI Computer Agent (Simular)At some point, even no‑code tools fall short. You want:- Cross‑app workflows: downloading CSVs, logging into dashboards, cleaning data, updating Google Sheets, tweaking pivot layout.- Human‑like reliability across thousands of steps per week.Simular’s AI computer agents are built exactly for this: they operate your desktop and browser as a power assistant, but with production‑grade robustness.#### Method 7: Agent‑driven daily pivot refresh**Scenario:** A marketing agency reports performance across 20 clients.**What the Simular agent does:**1. At 7 AM, the agent launches your browser and logs into ad platforms.2. It exports CSVs, saves them locally, and opens Google Sheets.3. It uploads or pastes fresh data into each client’s raw tabs.4. It navigates to a `Combined_Query` sheet, checks that the QUERY formulas are intact, and corrects obvious errors.5. It opens the pivot table sheet, verifies totals, and formats key cells.6. Optionally, it downloads a PDF of the pivot and emails it or drops it into Slack.**Pros:**- Removes you entirely from the grunt work.- Works across web apps, not just Sheets.**Cons:**- Requires initial workflow design and testing.- Best suited for recurring, well‑defined processes.Learn more about Simular Pro’s capabilities: https://www.simular.ai/simular-pro#### Method 8: Agent‑powered, per‑client pivot templates**Scenario:** You onboard new clients every week and need identical but separate reporting.**Workflow:**1. Maintain a “pivot template” spreadsheet with all formulas and pivot layouts.2. When a new client signs, trigger a webhook that pings Simular.3. The Simular agent: - Duplicates the template file. - Renames sheets with the client’s name. - Connects data sources (for example, updates IMPORTRANGE references to the client’s raw file). - Opens the pivot editor and adjusts filters (for example, sets `ClientName = X`).4. The agent logs results so your team can review.**Pros:**- Hyper‑scalable: same workflow for 5 or 500 clients.- Transparent execution; every click is inspectable and tweakable.**Cons:**- Slightly more complex to design than a simple Zap.- You still own the logic; the agent executes it reliably.With Simular’s neuro‑symbolic approach, you get the flexibility of LLMs with the precision of deterministic flows, which is exactly what fragile spreadsheet processes need. Instead of worrying that one broken formula will ruin your Monday, you let a repeatable AI agent build, refresh, and audit your Google Sheets pivot tables from multiple sheets—while you focus on winning the next deal.

Scale Google Sheets Pivots with an AI Agent Guide!

Onboard Simular to pivots
Install Simular Pro on your Mac, then record a simple workflow: open Google Sheets, load the right spreadsheet, navigate tabs, and build or refresh your multi‑sheet pivot template.
Test and refine the agent
Run the Simular AI agent on a copy of your Google Sheets file. Let it update sources and pivots while you watch, then tweak steps, add checks, and lock in a reliable first‑time run.
Delegate and scale pivots
Once confident, schedule the Simular AI Agent or trigger it via webhook. It will update Google Sheets pivots from many sheets for all clients, turning a weekly chore into a fully automated workflow.

FAQS