Oops! Something went wrong while submitting the form.
How to build a sample income statement in Google Sheets
Use Google Sheets and Simular Pro to turn transactions into a clear income statement, powered by an AI computer agent that updates and checks it for you.
Most small businesses run on instinct for far too long. A sample income statement is your first honest conversation with the numbers: What do we actually sell? What does it cost us to deliver? What is left after rent, payroll, and tools? Templates from sources like Smartsheet and Coefficient make it easy to plug in revenue, COGS, and expenses so you can compare months or years side by side and spot trends before cash runs tight.
But building and maintaining that statement by hand is where owners get stuck. This is where an AI computer agent shines. Imagine Simular quietly logging into your accounts, pulling fresh data, and posting it into your Google Sheets template every week. Instead of chasing receipts at 11 p.m., you open one tab and your story is already written: clean totals, updated margins, and a living statement you can use to make the next move with confidence.
How to build a sample income statement in Google Sheets
How to create a sample income statement at scale
You do not need to be an accountant to keep a sharp eye on your profit. You need a simple structure, a reliable template, and a smart way to keep it updated. Let us walk through three levels of maturity: manual, no‑code automation, and fully agentic with Simular.
1. Traditional manual methods (the starter playbook)
These are the ways most founders begin. They are simple, but time‑intensive.
Method 1: Use a printable template in Google Sheets
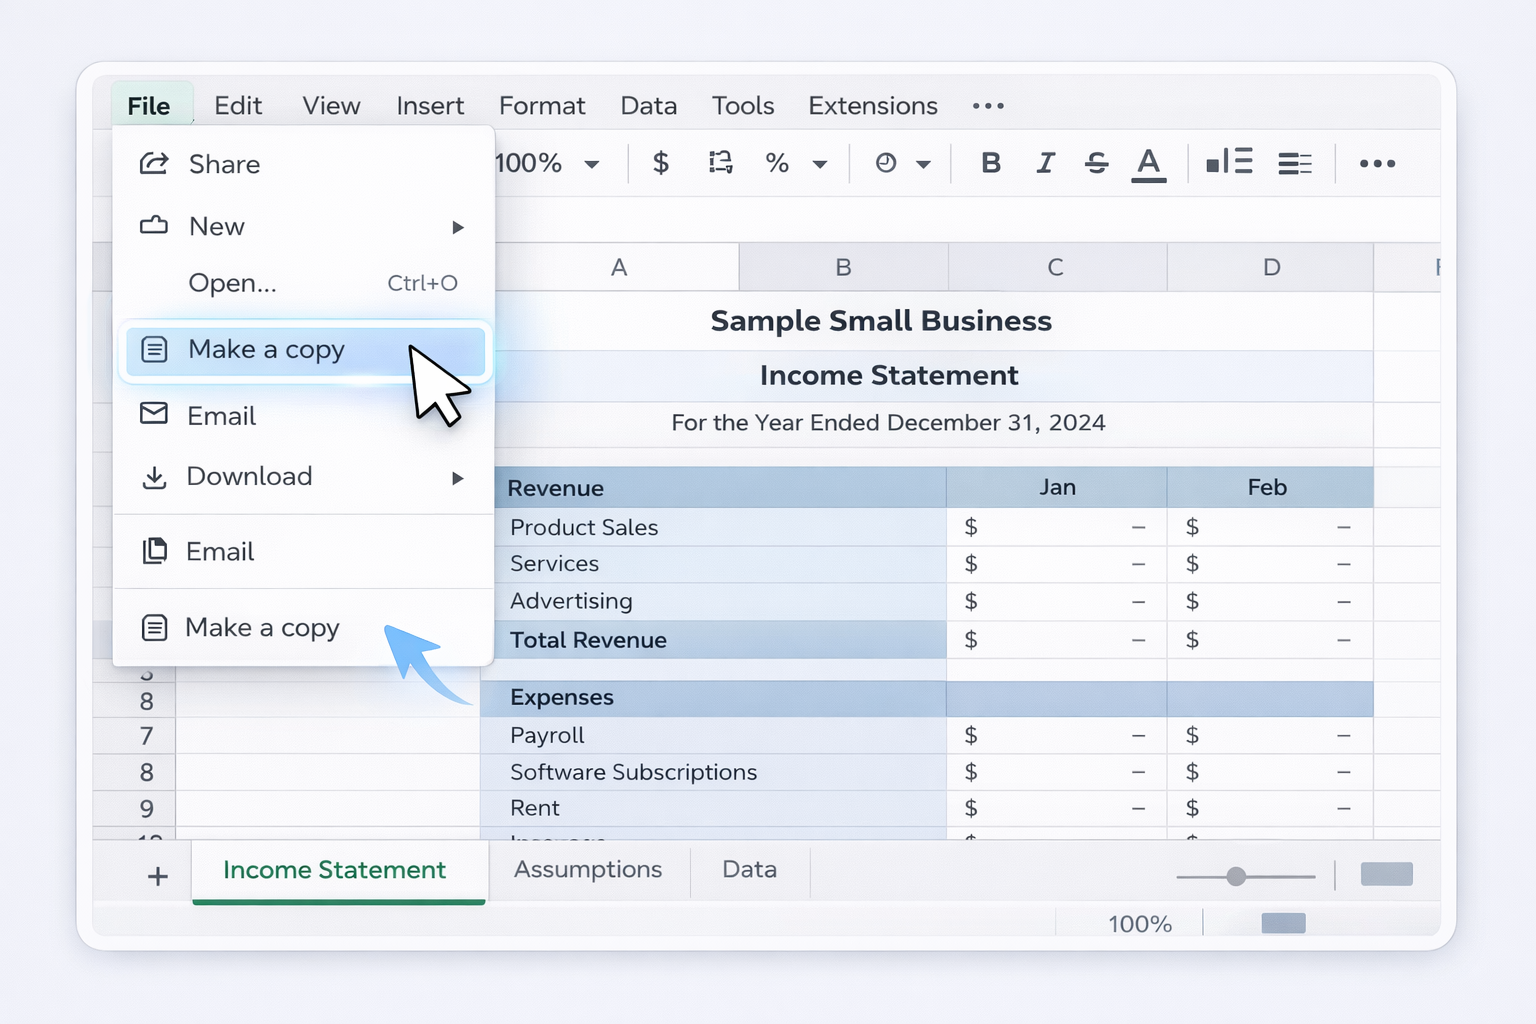
Open a ready‑made template such as Smartsheet's Sample Small Business Income Statement (available as Google Sheets).
In Google Sheets, go to File → Make a copy so you have your own editable version.
Customize the Revenue and Expenses lines for your business (for example, Product sales, Services, Advertising, Software subscriptions, Payroll).
Each month, export your bank or payment processor transactions as CSV.
In Sheets, use File → Import to bring in the CSV to a separate tab.
Manually sum revenue and expense categories and paste totals into the income statement.
In column A, add headings: Revenue, COGS, Gross profit, Operating expenses, Net income.
Under Revenue, list each income stream; under COGS, list direct costs; under Operating expenses, list overhead like rent, utilities, tools, and salaries.
In the Revenue total row, use SUM (for example, =SUM(B3:B10)). Do the same for COGS and Operating expenses.
Calculate Gross profit as Revenue total minus COGS total.
Calculate Net income as Gross profit minus Operating expenses.
Add a second tab and copy the structure for each new month, so you can compare periods.
Pros: Tailored to your business, no dependency on external templates. Cons: Takes time to design, more formulas to maintain.
Method 3: Track daily cash and roll up to a monthly statement
Use a Daily Income and Expenditure template (Smartsheet and Coefficient both provide Google Sheets versions).
Every day, enter cash receipts, payments, and card transactions.
At month‑end, group daily lines into categories that match your income statement (Sales, COGS, Rent, Marketing, etc.).
Use SUMIF in Sheets to total each category for the month.
Paste or link those totals into your main income statement tab.
Pros: Great visibility into cash, fewer surprises. Cons: High data entry burden; owners often abandon this when things get busy.
2. No‑code automation with standard tools
Once the structure works, your next bottleneck is data entry. No‑code tools can automate the plumbing.
Method 4: Connect your bank or accounting app to Google Sheets
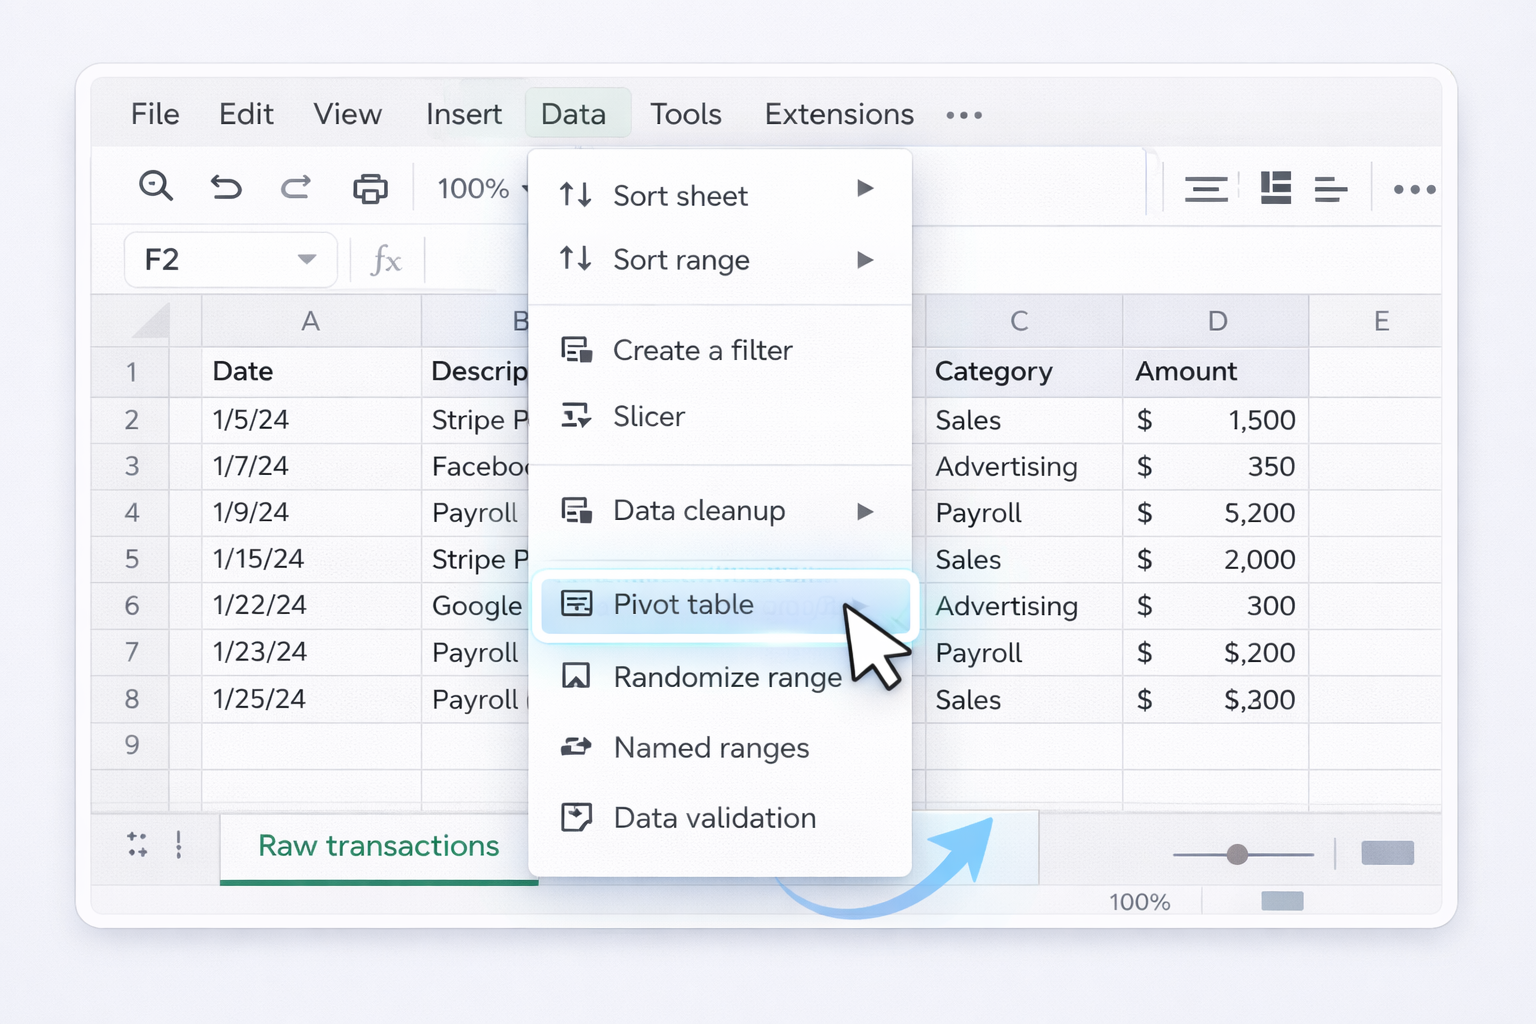
Use an integration tool (for example, a Sheets add‑on or your accounting system's native export) to sync transactions into a dedicated "Raw transactions" tab.
In Sheets, define a Category column and create rules or filters to group items (for instance, all Stripe payouts to "Sales", all Facebook charges to "Advertising").
Link those pivot totals directly into your income statement tab with formulas like =GETPIVOTDATA(...) or simple cell references.
Schedule the sync to run daily or weekly so your statement is always current.
Pros: Less manual grunt work, faster updates, still transparent. Cons: Setup can be fiddly; you still need to maintain categorization logic.
Method 5: Use prebuilt income statement templates with live data
Download a Small Business Income Statement Template from Coefficient or Smartsheet in Google Sheets format.
Follow the vendor's guide to connect live data sources (for example, QuickBooks, Xero, or Stripe) into the "Data" tabs.
Map imported fields (date, description, amount, account) to the template's categories.
Use built‑in dashboards to compare monthly or yearly performance without rebuilding charts.
Pros: Professionally designed, quick to get insights, great for agencies managing multiple clients. Cons: You are limited to the template's structure; customization can be complex.
3. Scaling with an AI computer agent (Simular Pro)
When you are running a busy agency or multi‑location business, even no‑code automations leave gaps: odd transactions to fix, exports to download, new clients to onboard. This is where an autonomous computer‑use agent is powerful.
Simular Pro is designed to behave like a reliable digital operations assistant across your desktop and browser.
Method 6: Have Simular maintain your Google Sheets income statement
Idea: Treat Simular as your AI bookkeeper that logs in, gathers data, and posts clean totals into your template.
Record or describe a workflow where a human would:
Open your browser, log into your bank and payment platforms.
Download monthly CSV exports.
Open Google Sheets, locate the income statement file, and go to the "Raw data" tab.
Import or append the latest CSVs.
Refresh pivot tables or category formulas.
Configure Simular Pro to execute each of these actions, using its transparent execution view so every click, keystroke, and navigation step is inspectable and editable.
Add safeguards: for example, ask Simular to highlight any transaction over a certain amount or from a new vendor on a separate "Review" tab.
Schedule this workflow weekly or at month‑end via your existing orchestration (using Simular's webhook integration into your pipeline).
Pros: Offloads repetitive multi‑app work, production‑grade reliability over thousands of steps, fully traceable. Cons: Requires initial setup and clear process definition; best suited once you have stable templates.
Method 7: Use Simular to generate and compare sample statements for many clients
If you run an agency or bookkeeping shop, you may be building nearly identical income statements for dozens of small businesses.
Standardize a master Google Sheets template with your preferred chart of accounts and KPIs.
For each new client, Simular Pro can:
Create a copy of the master template.
Rename it with the client name and period.
Connect or import the right CSV exports and starting balances.
The agent can then:
Populate revenue, COGS, and expense mappings.
Generate comparative tabs (this month vs last month; this year vs last year) using formulas shown in vendor templates.
You review the first run for each client, then let Simular handle ongoing monthly updates.
Pros: Massive time savings at portfolio scale, consistent structure, easy to hand off reports to your team or clients. Cons: Needs good folder organization and role‑based access; you must define clear guardrails for sensitive logins.
For more on Simular's approach to autonomous agents and reliability, see https://www.simular.ai/about and https://www.simular.ai/simular-pro. Combined with battle‑tested Google Sheets templates, an AI computer agent lets you keep a sample income statement always current, without sacrificing transparency or control.
Automate income statements with Google Sheets & AI
Train your AI agent!
Install Simular Pro, open your Google Sheets income statement, then demonstrate how you import CSVs and update totals so the AI agent can mirror every step reliably.
Test & refine agent run
Use Simular Pro’s transparent execution to watch each click as it updates your sample income statement. Fix missteps, adjust timing, and lock in a stable first successful run.
Launch and scale tasks
Once the Simular AI agent runs cleanly, schedule it to refresh Google Sheets for every client or business unit, scaling income statement updates without extra headcount.
Learn how to automate Google Sheets
Cloud spreadsheets that let small businesses track revenue, expenses, and net income in a flexible sample income statement template, shareable live.


.svg)