How to Build a Google Sheets Variance Report Guide

Automate budget vs actuals in Google Sheets with an AI computer agent that pulls data, calculates variances, and narrates what changed and why every month.
Advanced computer use agent
Production-grade reliability
Transparent Execution

Google Sheets and AI agents

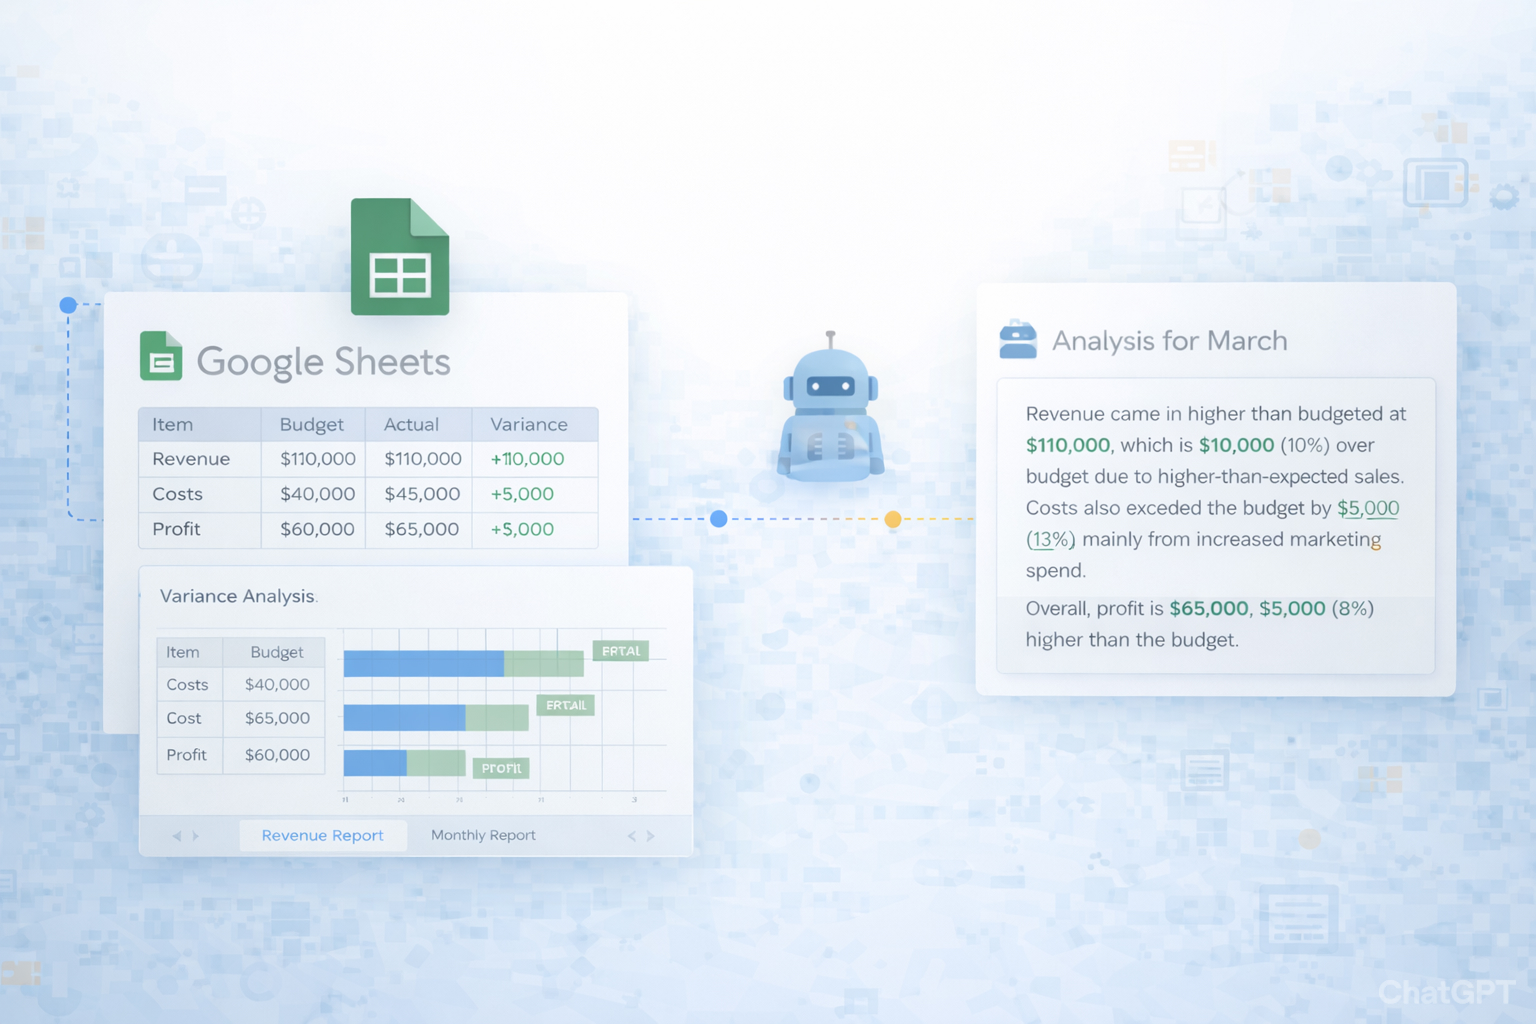
Variance analysis is the financial dashboard of your business. It shows, line by line, where your plan and reality drift apart and why. Without a living variance report, budgets turn into wish lists and leaders steer by instinct instead of evidence.A strong variance report in Google Sheets compares budget, forecast, and actuals, quantifies the gaps, and surfaces the drivers behind them: pricing, volume, channel mix, overhead. That clarity lets you adjust campaigns, headcount, or spend before small leaks turn into a cash crisis.But assembling that picture manually is slow and brittle. This is where an AI computer agent earns its keep. Once it knows where your data lives and how your sheet is structured, it can fetch fresh actuals, recalculate variances, flag material exceptions, and even draft plain‑English commentary. Delegating the grunt work to an agent means variance insight arrives on time, every time, while your team focuses on decisions, not spreadsheets.

How to Build a Google Sheets Variance Report Guide

When revenue slips or costs creep up, the story shows up first in your variance report. The catch: building that report consistently is tedious. Let’s walk through three levels of sophistication, from fully manual to fully agentic, so you can choose how far to automate.## 1. Manual variance reporting in Google SheetsThese methods are simple, familiar, and a great starting point.
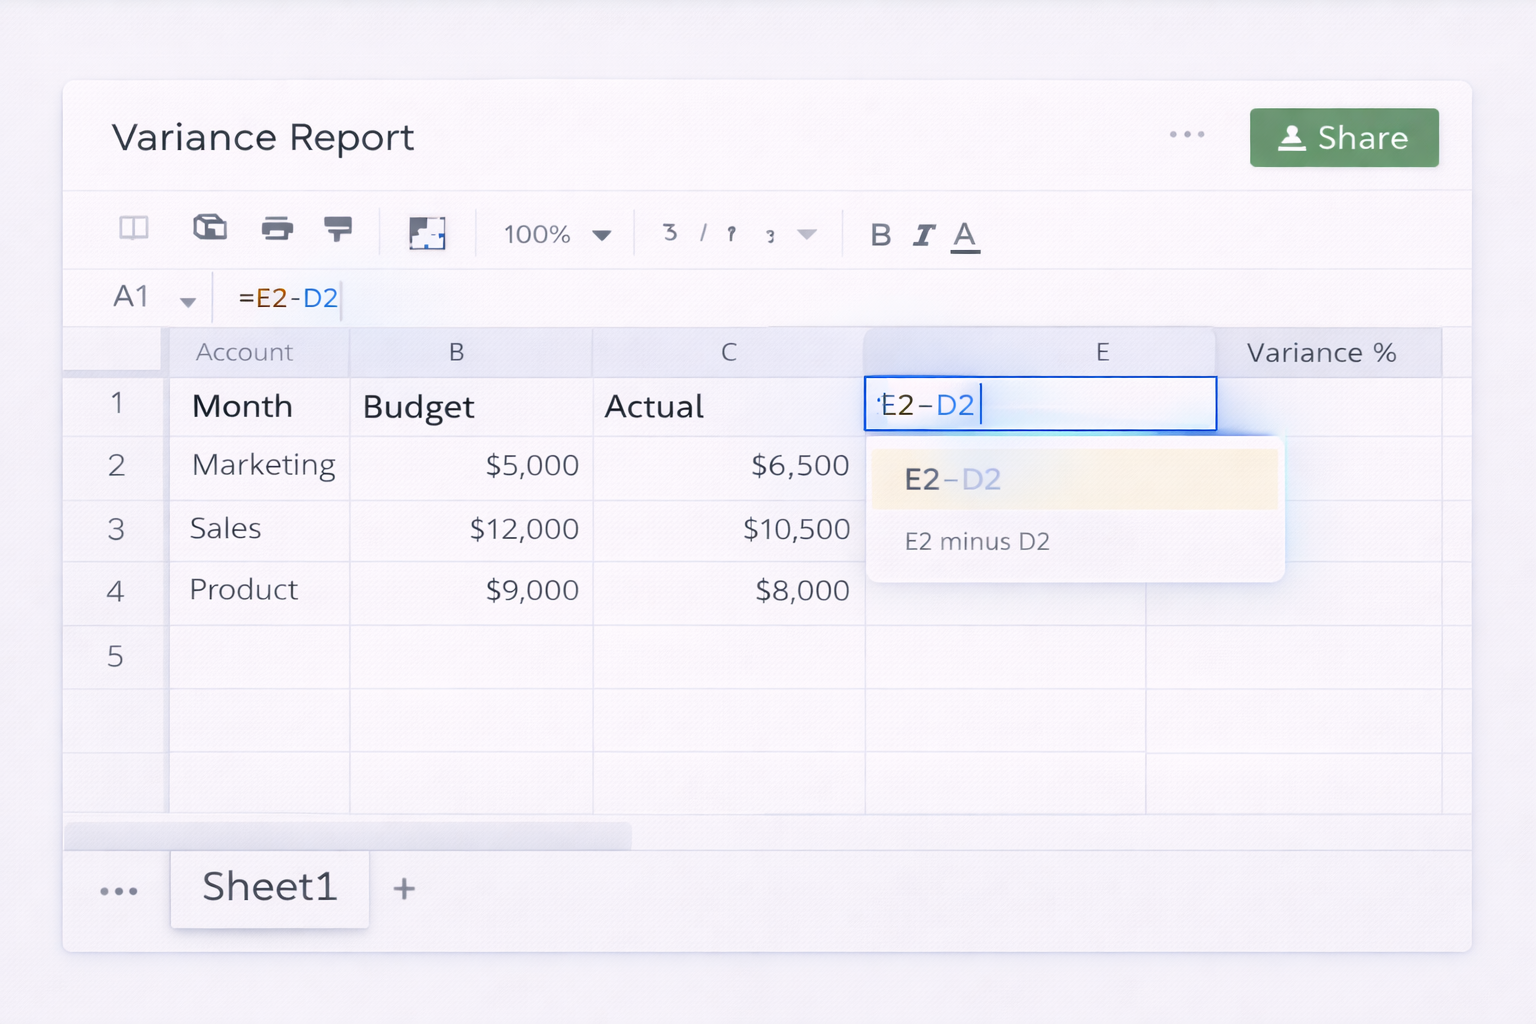
### 1.1 Build a basic variance layout1. In Google Sheets, create columns like: Account, Month, Budget, Actual, Variance, Variance %.2. Enter or paste your budget numbers in the Budget column.3. Paste your actuals from your accounting or sales tools into the Actual column.4. In the Variance column, use a formula such as: - `=E2-D2` (Actual minus Budget, adjust columns to your layout).5. In the Variance % column, use: - `=(E2/D2)-1` and format as percentage.See Google’s docs on formulas here: https://support.google.com/docs/answer/3094282### 1.2 Highlight the important gapsWalls of numbers don’t drive action; color does.1. Select the Variance % column.2. Go to Format → Conditional formatting.3. Add a rule like "Greater than 0.1" (or 10%) and choose a bold green.4. Add another rule like "Less than -0.1" and choose red.Official guide: https://support.google.com/docs/answer/78413Now a quick scan tells you which lines are beating plan and which are bleeding.### 1.3 Summarize with charts and pivotsExecutives and clients often want the 10,000‑foot view.1. Insert a Pivot table (Insert → Pivot table) using Account as rows and Month as columns.2. Add Budget and Actual as values.3. Add a calculated field inside the pivot (or in a helper sheet) for Variance %.4. Select the pivot and Insert → Chart to create a simple variance bar or line chart.Google’s chart help: https://support.google.com/docs/answer/63824Pivot tables: https://support.google.com/docs/answer/1272900**Pros:**- Full control and transparency.- No extra tools needed.**Cons:**- Time‑consuming data entry.- Easy to break formulas when copying or inserting rows.## 2. No‑code automation around Google SheetsOnce you trust your layout, the next drag is getting fresh data into the sheet and keeping it structured. You can reduce that friction without writing code.### 2.1 Use built‑in import functions
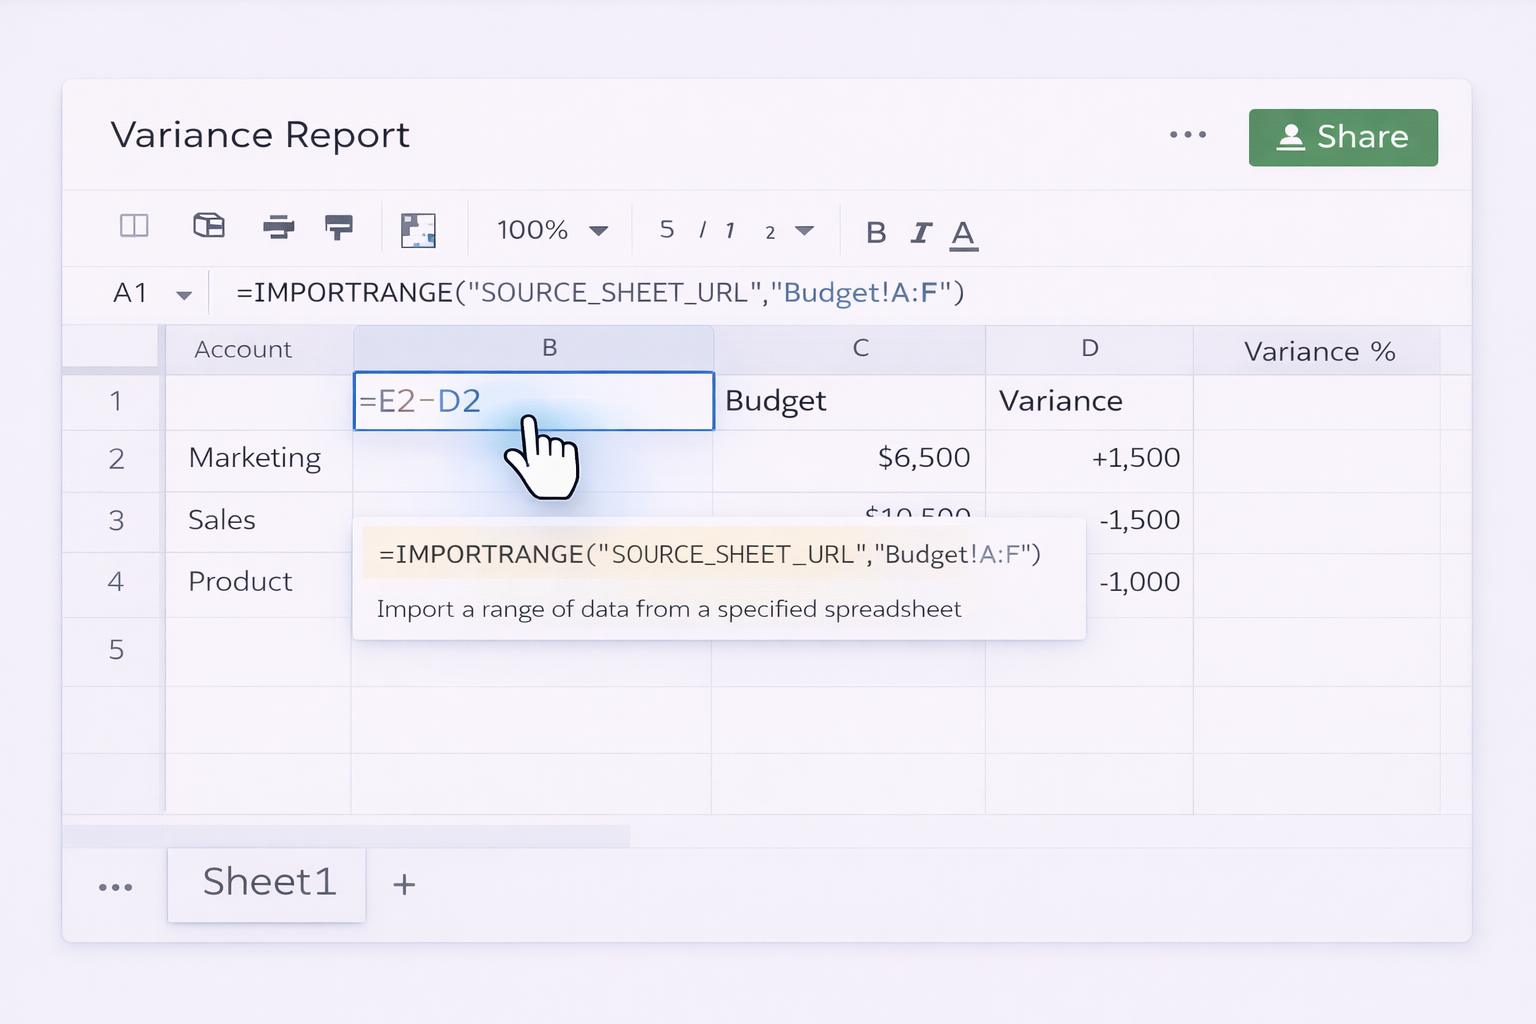
If your budget and actuals live in different spreadsheets:1. In your variance file, use `IMPORTRANGE` to pull in source data: - `=IMPORTRANGE("SOURCE_SHEET_URL","Budget!A:F")`2. Map imported columns into your main variance table with `VLOOKUP` or `INDEX/MATCH`.Docs on IMPORTRANGE: https://support.google.com/docs/answer/3093340This keeps everything live: when upstream sheets change, your variance updates.### 2.2 Connect apps with no‑code toolsTools like Zapier, Make, or native connectors from your CRM/accounting platform can push data into Sheets automatically.Typical workflow:1. Trigger: "New invoice posted" or "Daily at 1am".2. Action: Append a row in a raw data tab in Google Sheets with date, account, amount, and tags (client, channel, campaign).3. In your variance tab, roll up those raw rows into Actuals with `SUMIFS`, grouped by account and month.**Pros:**- Eliminates manual CSV downloads.- Still keeps logic visible in Sheets where finance and sales teams are comfortable.**Cons:**- You maintain both the no‑code flows and the formulas.- Complex businesses produce many zaps/scenarios to manage.### 2.3 Add light scripting with Apps ScriptIf you’re comfortable with light scripting, Google Apps Script can:- Refresh data ranges.- Rebuild pivot tables.- Email a PDF of the variance report.Apps Script overview: https://developers.google.com/apps-script/guides/sheetsThis is still "you coding" rather than delegating, but it’s a big step up from pure manual work.## 3. Scaling variance analysis with an AI agentAt some point your variance workflow stops being a single spreadsheet and turns into a complex ritual: logging into multiple tools, exporting files, cleaning data, updating Google Sheets, formatting, and then writing commentary for stakeholders. This is where an AI computer agent shines.Simular Pro is a production‑grade computer‑use agent that can operate your desktop, browser, and cloud tools much like a human analyst would. It already automates tasks like scraping data into Google Sheets, researching companies, and generating reports.Learn more: https://www.simular.ai/simular-pro### 3.1 Agent‑driven monthly closeImagine your month‑end close as a checklist an AI agent executes for you:1. The agent opens your accounting system in the browser.2. It exports P&L and departmental reports as CSVs.3. It uploads those files to Google Drive.4. It opens your Google Sheets variance workbook.5. It replaces the previous month’s actuals tab with the new CSV data.6. It checks formulas in the Variance and Variance % columns by comparing a few sample rows against a reference.7. It applies or refreshes conditional formatting.8. It generates a text summary of the top 10 favorable and unfavorable variances and pastes it into a "Commentary" sheet you review.**Pros:**- Offloads the most repetitive multi‑system steps.- Transparent execution: every click and edit is visible and reviewable.- Scales to many entities or clients with small configuration tweaks.**Cons:**- Requires upfront onboarding of the agent to your stack.- Best run on a dedicated machine (for example, a Mac with Simular Pro installed).### 3.2 Always‑on variance watchdogYou can also use an AI agent as a variance "sentry" that looks for trouble (or opportunity) before your scheduled reviews.Example routine:1. On a schedule (say, daily at 7am), trigger the agent via webhook from your orchestration tool.2. The agent opens the Google Sheets variance file.3. It scans for any line where absolute Variance % is above a threshold (for example, 15%) for the last 7 days.4. It drafts a short email or Slack message to the owner (sales lead, marketing manager, finance head) explaining which lines moved and suggesting likely causes based on historical patterns.Because Simular’s actions are inspectable, you can see exactly how it filtered, which cells it read, and what logic it applied.### 3.3 Multi‑client variance reporting for agenciesFor agencies managing many clients, an AI agent can:1. Log into each client’s ad platforms and CRM accounts.2. Export spend and revenue data.3. Update each client’s Google Sheets variance template.4. Assemble a slide or doc summary per client, using the sheet as the data source.Run that overnight, and your account managers start the day with fresh variance insight instead of a to‑do list of exports.Learn more about Simular’s agentic approach: https://www.simular.ai/about**Pros:**- Huge leverage for agencies and multi‑brand companies.- Frees sales and marketing leaders from spreadsheet chores.**Cons:**- Needs governance: clear rules on what the agent may or may not change.- Best results when someone owns the "playbook" the agent follows.Start wherever you are: a clean manual Google Sheets layout, a bit of no‑code plumbing, and then a Simular AI agent to execute the repetitive cross‑tool work. Each step buys back more of your team’s time for strategy instead of mechanics.

Scale variance reports with Google Sheets and AI

Train Simular agent
Install Simular Pro, open a sample Google Sheets variance file, then guide the agent through exporting actuals, pasting into the sheet, and recalculating variances end to end.
Test and refine runs
Replay the workflow while watching every step: let the Simular agent refresh Google Sheets, compare its variances to your own test sheet, tweak prompts or limits, then rerun until results match.
Scale delegation
Once stable, trigger the Simular AI Agent from a webhook or scheduler so it updates Google Sheets on a cadence, emails variance summaries, and scales to more entities with minimal extra setup.

FAQS