Oops! Something went wrong while submitting the form.
How to Track Cleaning Stock in Google Sheets & Excel
Build a cleaning supplies inventory in Google Sheets and Excel, then let an AI computer agent keep it updated, flag low stock, and prepare orders for you!
In most cleaning businesses, inventory lives in someone’s head and a half-finished spreadsheet. That works until a big client walk-through, a flu season spike, or a franchise rollout exposes every gap: missing disinfectant, no spare mop heads, overstocked glass cleaner. A structured cleaning supplies inventory template in Google Sheets or Excel turns that chaos into a single source of truth.\n\nWith clear columns for item name, SKU, location, units, cost, and reorder points, you can see exactly what’s on the shelf, where it sits, and how fast it’s being used. Templates also standardize data entry across sites and shifts, making it easier to compare branches, negotiate with suppliers, and forecast peak seasons instead of guessing.\n\nNow layer in an AI computer agent. Instead of staff spending hours counting and typing, the agent can read purchase orders, delivery notes, and digital checklists, then update Google Sheets and Excel for you. It can watch consumption patterns, highlight anomalies, and draft restock orders before supervisors even notice levels dipping. The result: fewer emergencies, more predictable margins, and frontline teams focused on cleaning, not clerical work.
How to Track Cleaning Stock in Google Sheets & Excel
1. Traditional, Manual Ways to Manage a Cleaning Inventory
Method 1: Paper logbook + weekly count
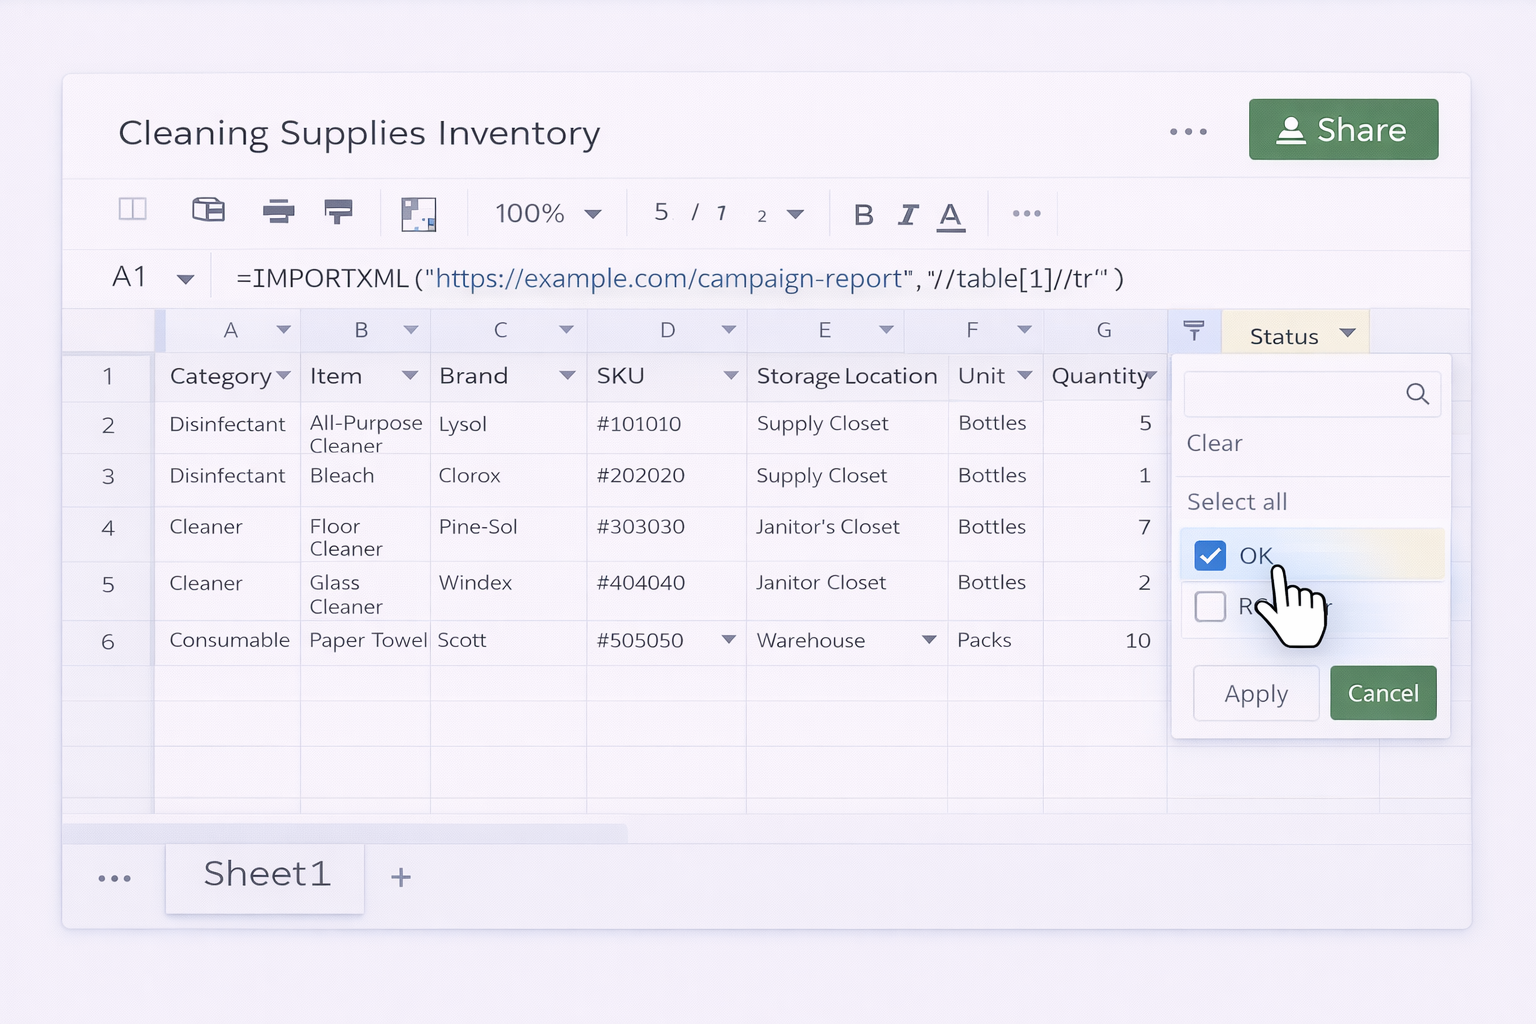
Print a simple checklist: columns for Item, Location, Unit size, Quantity on hand, Min level, Notes.
Store it in a binder in the supply closet or janitor room.
Once or twice a week, have a staff member walk each storage area, count items, and write quantities.
Compare counts to your minimum levels; highlight anything below threshold.
Manually create a purchase list from the highlighted lines and send it to your supplier or purchasing team.
Pros: Works without tech, easy to start. Cons: Error-prone, not real time, impossible to analyze across locations.
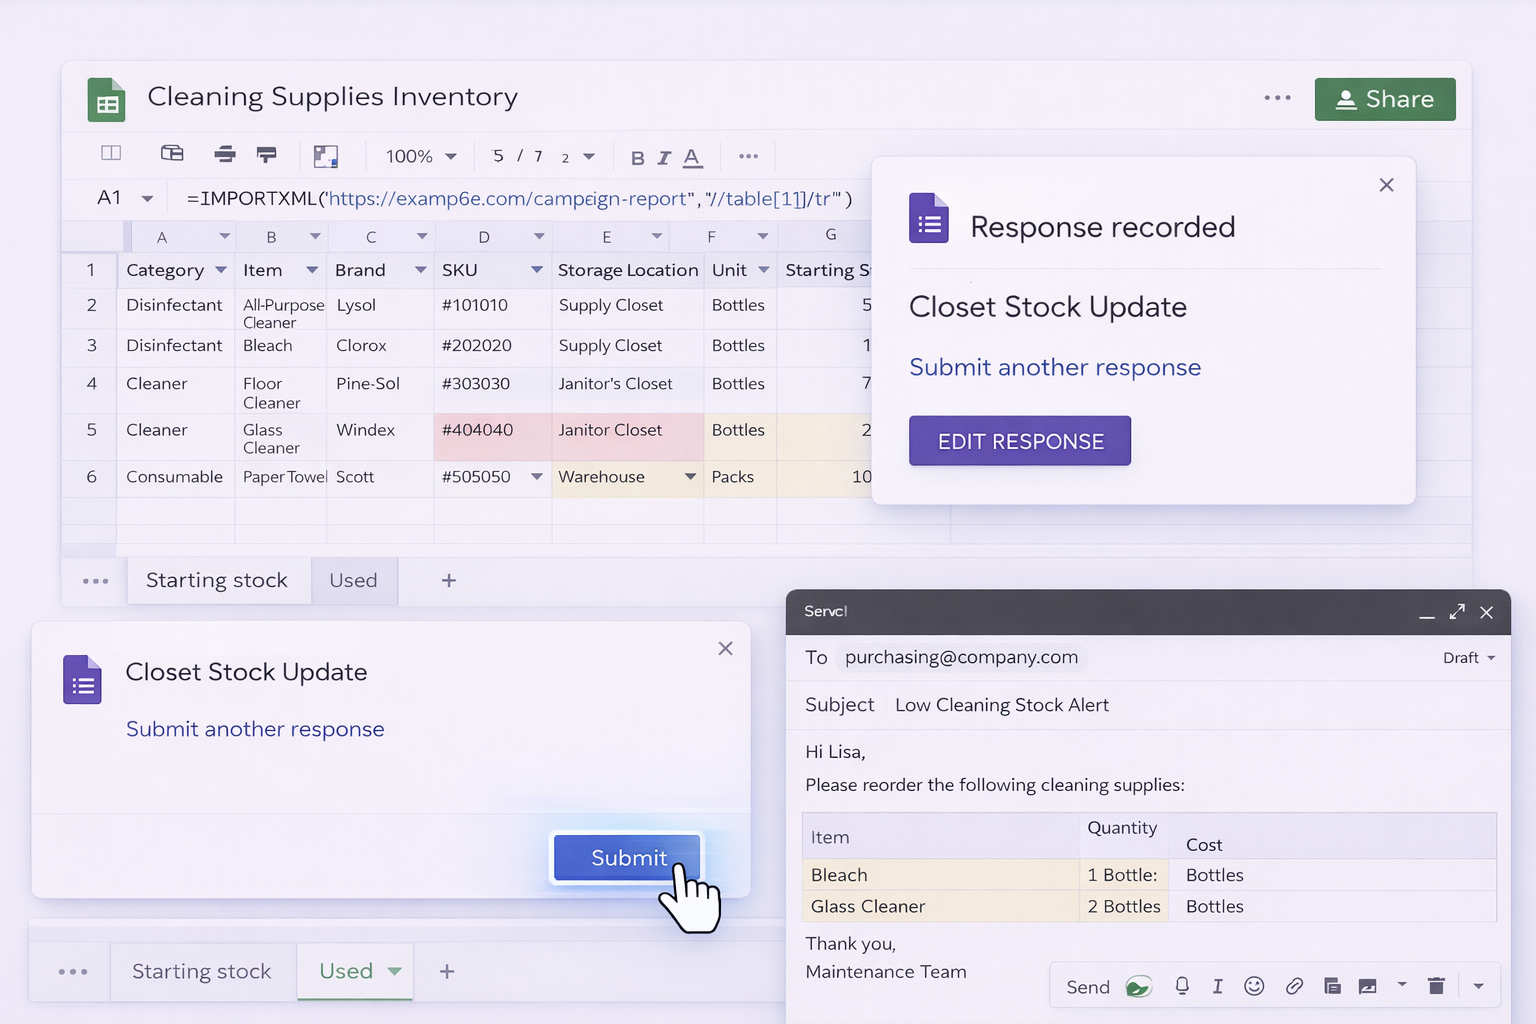
Each time staff take items from the closet, they submit a short form: Item, Quantity taken, Location.
Use formulas to subtract taken quantities from stock, e.g. maintain a "Starting stock" and "Used" sheet, then compute Current stock = Starting - SUM(usage).
Set up email notifications via Add-ons or simple Apps Script so that when any row goes to "Reorder", a purchasing email is drafted.
Pros: Reduces manual counting, simple mobile data entry. Cons: Still depends on staff submitting forms; setup requires some basic scripting.
Approach 2: Excel + Tables + Power Automate (for Microsoft 365 users)
Store your Excel inventory file in OneDrive or SharePoint.
Make sure your inventory range is an Excel Table (Insert → Table) so Power Automate can reference it reliably.
In Power Automate, create a flow that triggers on a schedule (e.g., daily).
The flow reads each row; if Quantity <= Reorder point, it:
Adds the item to a separate "Reorder" table, or
Sends an email to purchasing with the item list.
Optionally, add another flow that listens for form submissions or email confirmations from suppliers and updates an "On order" column.
Pros: Good for organizations already on Microsoft 365, less manual chasing. Cons: Power Automate has a learning curve; flows can break if table structure changes.
Approach 3: Cross-app syncing (Sheets ↔ other tools)
Use a no-code tool (like Zapier or Make) to connect Google Sheets inventory with other apps such as your ticketing or CRM system.
Trigger a workflow when a row in Sheets changes to Status = "Reorder".
The automation can create tasks, send Slack messages, or log purchase requests.
Keep the Sheets template as the single source of truth; other tools act as notification layers.
Pros: Better visibility across teams, less emailing. Cons: Multiple tools to manage; automations can become brittle as processes evolve.
3. Scaling with AI Agents (Simular)
Now imagine the inventory template in Google Sheets or Excel is just the hub, and a Simular AI agent does the clicking, typing, and cross-checking.
Method 1: Agent-driven digital walk-through
Workflow:
Staff upload photos or a quick video of shelves to a shared folder or drive.
A Simular agent opens the folder, inspects images, and cross-references labels or SKUs with your existing inventory list.
It updates quantities in Google Sheets or Excel, row by row, just like a human would, but faster and more consistently.
It then filters to low-stock items, drafts a reorder sheet, and even opens your supplier’s portal in the browser to prepare a cart for review.
Pros: Massive time savings on counting and data entry; works across desktop, browser, and cloud. Cons: Initial setup and instructions must be clear; best for businesses with recurring, stable product lines.
Method 2: Autonomous reorder forecasting and prep
Workflow:
The Simular agent periodically opens your Google Sheets or Excel inventory file.
It analyzes historical usage (weekly or monthly deltas) and compares against upcoming contracts or seasonal spikes.
Using your defined business rules (target days-on-hand, preferred suppliers, packaging sizes), it calculates suggested order quantities.
It creates a new tab: "Next Order", populates item, quantity, supplier, and estimated cost, and sends you a summary via email or chat.
Pros: Moves you from reactive to proactive purchasing; leverages existing templates and tools. Cons: Requires good historical data; humans still need to approve orders (which is usually desirable).
For each site, the Simular agent opens that location’s Google Sheets or Excel file, or logs into its local system.
It normalizes data (units, naming, categories) into a master inventory workbook.
It then prepares location-specific restock plans and a consolidated purchasing view for HQ.
Through Simular’s transparent execution, ops leaders can inspect every step, tweak logic, and rerun workflows reliably.
Pros: Scales across dozens or hundreds of sites; no need to rip and replace existing tools. Cons: More complex orchestration; needs thoughtful governance and monitoring.
Across all three AI-driven methods, the key advantage is this: your managers stop babysitting spreadsheets and start making higher-level decisions, while the Simular agent handles the repetitive, cross-app work that humans find draining.
Automate Cleaning Inventory with AI Agents atScale
Train Simular agent
Define your ideal cleaning inventory template in Google Sheets or Excel, then teach the Simular AI agent which file to open, which columns matter, and how to update counts and flags.
Test & refine agent
Run the Simular AI Agent on a copy of your inventory sheet, watch each desktop and browser action, adjust instructions, then lock in a version that updates and flags stock correctly the first time.
Delegate and scale
Schedule the Simular AI Agent to maintain all site inventories, pushing updates into Google Sheets and Excel, generating reorder tabs, and scaling the same workflow across new locations in clicks.
Learn how to automate Google Sheets
Google Sheets lets your team log every mop, spray, and refill in one live cleaning inventory, update from any device, and share real-time stock levels with staff.
Excel gives you a structured cleaning inventory with tables, formulas, and conditional formatting to monitor stock, costs, and reorder points in a familiar interface.


.svg)