

Most small teams start budgets in a hurry: a blank Excel sheet, a few copied cells in Google Sheets, and suddenly the entire business is running on a fragile spreadsheet. A structured business budget template in Excel or Google Sheets fixes that. It gives you clear revenue and expense categories, monthly columns, built-in formulas for profit, and space for actuals vs plan. You can layer on Excel tools like variance analysis, charts, and What-If scenarios or use Google Sheets for always-fresh collaboration and commenting. Instead of rebuilding from scratch each quarter, you reuse and refine a single source of financial truth. That means faster decisions, cleaner handoffs to finance, and fewer late-night number checks before a client meeting or board call. When you delegate or automate this work to an AI agent, the story changes again: the agent becomes your tireless finance ops assistant, downloading statements, loading CSVs, updating tabs, and flagging anomalies before you even open the file, so your time goes into steering the business instead of wrestling spreadsheets.
SECTION 1 – Manual ways to build a business budget template | 1) Start from a blank sheet in Excel: Open Excel and create a new workbook. In row 1, add headers like Month, Revenue, COGS, Gross Profit, Operating Expenses, Net Profit. In column A, list your months. Under Revenue, add rows for your main income streams (e.g. Product sales, Services, Retainers). Under Operating Expenses, add rows for rent, payroll, marketing, tools, taxes, and other recurring costs. Use SUM formulas to total each category and a Net Profit formula like =SUM(B2:B5)-SUM(B7:B20) per month. See Microsoft’s guide to formulas for details: https://support.microsoft.com/office/overview-of-formulas-in-excel-ecfdc708-9162-49e8-b993-c311f47ca173. | 2) Use an Excel business budget template: Instead of designing from scratch, start from a ready-made budget. In Excel, go to File > New and search for Budget. Choose a Business budget or Monthly business budget template. Edit the category labels to match your business, remove what you do not need, and adapt formulas rather than overwriting them. Microsoft explains templates here: https://support.microsoft.com/office/use-templates-in-excel-0209f5f5-efc1-4f1a-bc9d-37c63a8f0a16. | 3) Build in Google Sheets from a template: In Google Sheets, click Template gallery and pick an Annual business budget or similar. Adjust columns to months or quarters, add rows for your revenue and expense categories, and use built-in functions like SUM, AVERAGE, and SUMIF to total and filter. Google’s guide to creating and editing Sheets is at https://support.google.com/docs/answer/6000292. | 4) Add actuals vs budget tracking: In either Excel or Google Sheets, reserve one column for Budget and one for Actual for each line item. Create a Variance column with a formula like =Actual-Budget and a % Variance column =IF(Budget=0,0,Variance/Budget). In Excel, apply conditional formatting to highlight large negative variances; see https://support.microsoft.com/office/use-conditional-formatting-cbfd4d9f-d7b4-4f09-aed9-fd79d4c2f80b. In Google Sheets, do similar via Format > Conditional formatting; details at https://support.google.com/docs/answer/78413. | 5) Visualize performance: Add charts to tell the story quickly. In Excel, select your monthly totals and insert a Column or Line chart via Insert > Charts, guided here: https://support.microsoft.com/office/create-a-chart-from-start-to-finish-0baf399b-3aa9-4f28-9e02-7ccecc1d3f80. In Google Sheets, use Insert > Chart; Google’s help: https://support.google.com/docs/answer/63824. Use one chart for Revenue vs Expenses over time and another for category breakdowns. | 
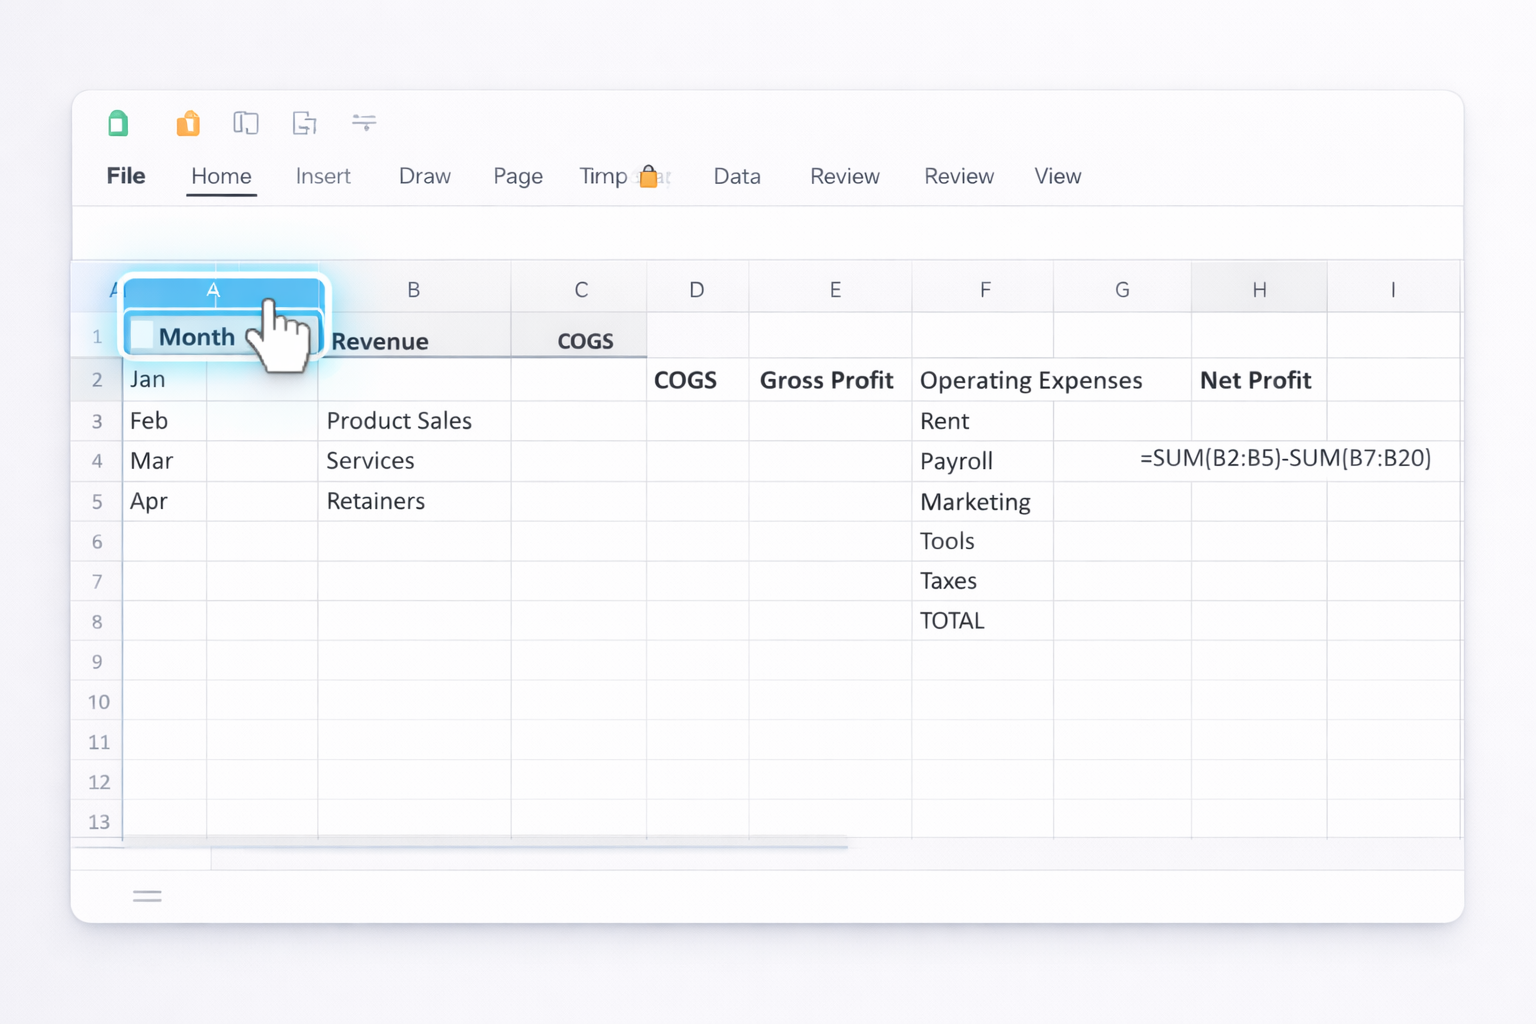
Pros of manual methods: Maximum control over structure; easy to start; no extra tools required. | Cons: Time-consuming updates; error-prone data entry; hard to scale across multiple clients or departments. | SECTION 2 – No‑code automation on top of Sheets and Excel
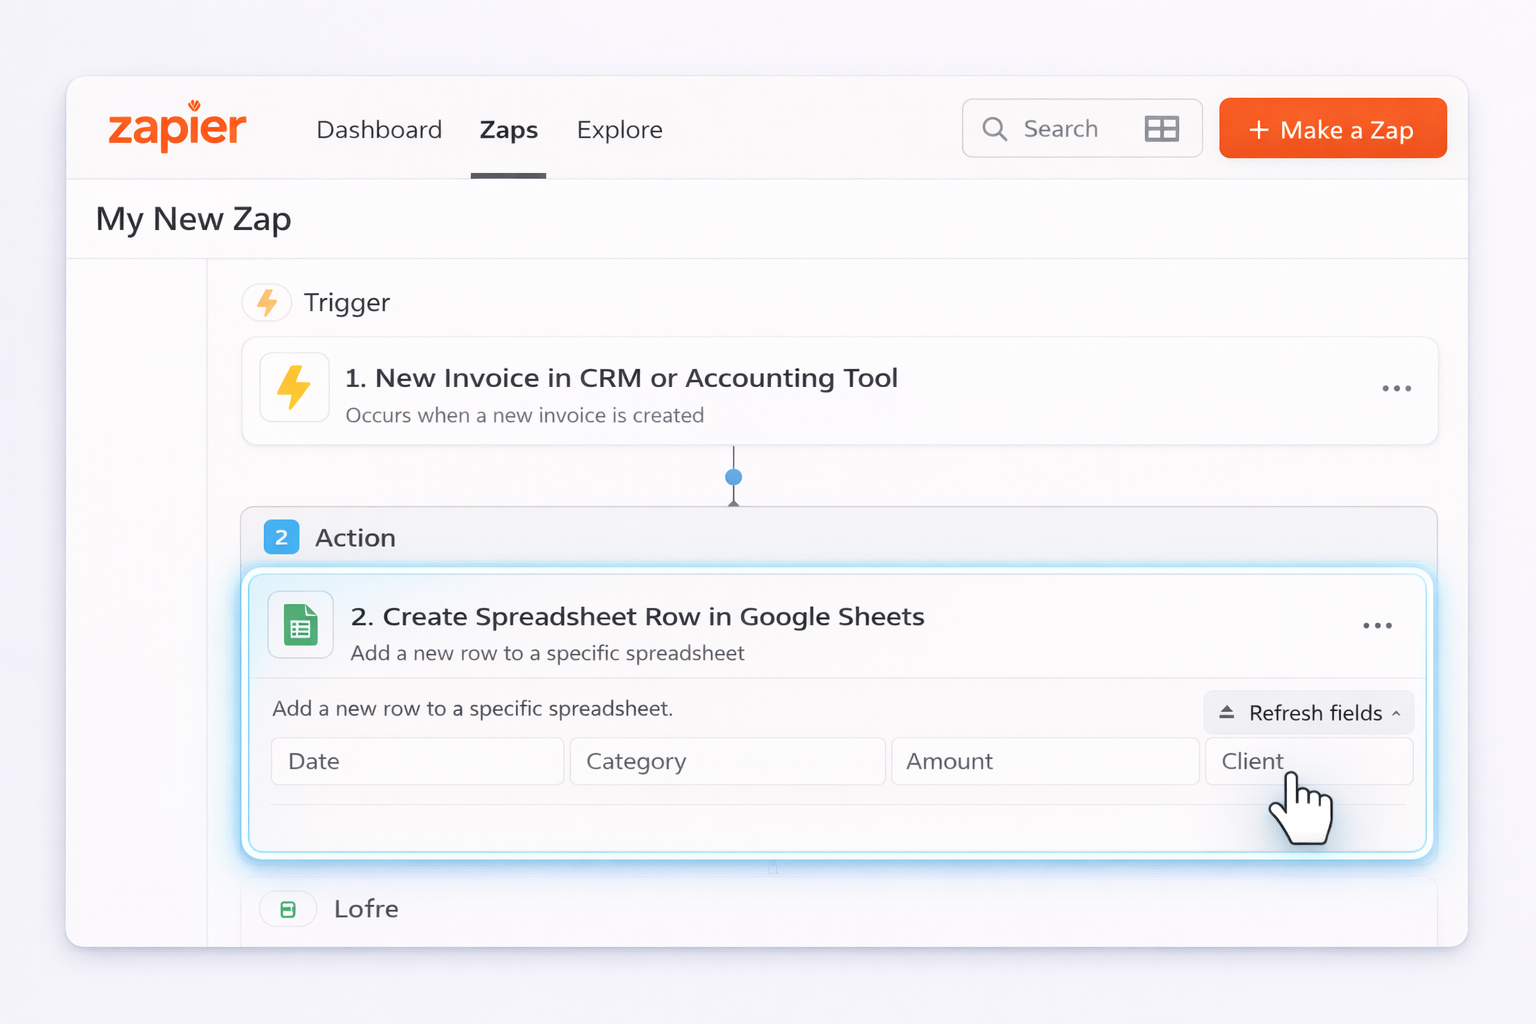
 | 1) Connect data sources with Zapier or Make: Instead of typing numbers, use automation tools to feed your budget. Example: create a Zap that triggers when a new invoice is created in your CRM or accounting tool, then appends a row to your Google Sheets budget Actuals tab. Map fields like date, category, amount, and client. For Excel Online, use the Excel connector to update a table in OneDrive. This keeps your budget living in Google Sheets or Excel while the data arrives automatically. | 2) Use Google Sheets formulas as lightweight automation: Turn your template into a living model. Use ARRAYFORMULA to auto-fill formulas down a column so you do not copy-paste every month. For example, in cell D2 (Variance) you might write =ARRAYFORMULA(C2:C-B2:B). Use QUERY to summarize by category or month in a separate dashboard tab. Google’s guide to functions is here: https://support.google.com/docs/answer/3094282. | 3) Automate imports in Excel with Power Query: In Excel, use Data > Get Data to pull CSV exports from your bank or accounting platform into a staging sheet. Clean columns once in Power Query (rename, filter, change data types), then load them into your budget table. Each month, click Refresh All and your Actuals update in seconds. Microsoft’s Power Query intro: https://support.microsoft.com/office/get-started-with-power-query-7104fbee-9e62-4cb9-a02e-5bfb1a6c536a. | 4) Schedule reporting: In Google Sheets, pair your budget with Looker Studio or simple email add-ons that send PDFs of your budget dashboard weekly to stakeholders. In Excel, save your workbook to OneDrive or SharePoint and use shared links for read-only access, explained here: https://support.microsoft.com/office/share-your-excel-workbook-with-others-9f7c21c9-1e8a-40fb-bcfc-c4bde19c88e6. | Pros of no‑code automation: Major time savings on data entry; fewer mistakes; good for agencies with multiple similar client budgets. | Cons: Still requires you to assemble the workflows; brittle when source systems or column names change; limited to predefined triggers and APIs. | SECTION 3 – Scaling with AI agents (Simular) | Here is where an AI computer agent becomes your quiet finance operator. Unlike typical bots, a Simular AI agent can use your desktop, browser, Google Sheets, and Excel almost like a human would, but it never gets tired. | 1) Agent as data loader and cleaner: You define a workflow once: open your bank and Stripe dashboards, download monthly CSVs, clean file names, open your Google Sheets or Excel budget template, paste or import data into the correct tabs, refresh pivot tables or charts, and log any anomalies into a Notes column. The Simular agent executes this entire multi-step process reliably each month. Pros: No more manual downloads; consistent process every time; works even when tools lack clean APIs. Cons: Requires a one-time setup and testing run; you must still review the final numbers. | 2) Agent for scenario planning and reviews: In Excel, the agent can duplicate your budget sheet into a new Scenario tab, tweak revenue growth or cost assumptions, and run What-If or Goal Seek to hit targets like desired profit, guided by Excel’s scenario tools at https://support.microsoft.com/office/introduction-to-what-if-analysis-22bffa5f-e891-4acc-bf7a-e4645c446fb4 and Goal Seek at https://support.microsoft.com/office/use-goal-seek-to-find-the-result-you-want-by-adjusting-an-input-value-320cb99e-f4a4-417f-b1c3-4f369d6e66c7. In Google Sheets, it can adjust key drivers and refresh charts to create quick best, base, and worst case tabs for clients or leadership. | 3) Agent as reporting and distribution engine: Once the month closes, your Simular AI agent can export the updated Excel or Sheets budget as a PDF, compose a short summary of key changes, and send it via email or upload to shared drives. It reads the numbers, highlights big swings in categories, and drafts commentary you can quickly approve. Pros: End-to-end automation from raw data to stakeholder-ready update; huge time savings for agencies managing many accounts. Cons: You need clear guardrails so the agent does not accidentally send drafts before you review; still requires your judgment on narrative and decisions.
Start by deciding what decisions your budget must support: cash runway, hiring, marketing spend, client profitability, or all of the above. Then design the layout backwards from those questions. In a new Excel workbook, create a Summary tab with a simple table for each month showing Total Revenue, Total Expenses, and Net Profit, plus key ratios like profit margin. Next, create a Detail tab. In column A list your categories in a logical order: Revenue streams at the top, then Cost of Goods Sold, then Operating Expenses grouped into Payroll, Marketing, Tools, Office, Travel, Other. Across columns, use one column per month. Under each section, leave a Subtotal row using SUM formulas. Link the Summary tab to these subtotals with direct cell references so any change in Detail updates your top-level numbers. Use consistent naming and avoid hard-coding numbers into formulas. Finally, add a Notes column for context on big movements; that narrative becomes invaluable when you revisit the budget later.
Create a structure that supports both plan and reality side by side. In either Google Sheets or Excel, set up columns such as Category, Budget Jan, Actual Jan, Var Jan, Var% Jan, Budget Feb, Actual Feb, and so on. For each month, Var is simply Actual minus Budget and Var% is Var divided by Budget with an IF to avoid divide-by-zero errors. In Excel, add conditional formatting so large negative variances show in red and positive ones in green; in Google Sheets, use Format > Conditional formatting in the same way. To simplify reporting, build a PivotTable (Excel) or pivot table (Sheets) summarizing Actual vs Budget by category or department. Refresh these each month after updating your Actual columns. If your data comes from other systems, standardize category names so every transaction lands in the right row. The key is consistency: same categories, same formulas, and a ritual where, after imports, you scan the largest variances and annotate them in a Notes column so the numbers tell a story.
Free templates in Google Sheets and Excel are a great starting point, but you want to adapt them without breaking their structure. First, make a copy of the original template file and never touch the source. In the copy, change only labels and assumptions first, not formulas. For example, rename revenue lines to match your actual products or services and adjust starting budget numbers. Then audit formulas: click into key total cells and trace which ranges they reference. If you need extra rows, insert them inside the existing ranges so SUM formulas still include them; otherwise, update the ranges manually. In Excel, use Formulas > Show Formulas to see everything at once; in Google Sheets, you can toggle formula view with Ctrl+` (backtick). After customizing, test with a small data set: enter fake numbers, verify that totals, variances, and charts update logically, and only then roll it out to live use. This protects you from silent formula errors that can mislead your decisions.
For teams, Google Sheets and Excel Online are your best friends. In Google Sheets, store the budget in a shared Drive folder, then use Share to give edit access to owners and comment-only access to others. Encourage teammates to use comments on specific cells instead of changing formulas directly; this keeps the logic stable while collecting feedback. Set up a simple change log tab where you manually note big structural edits. In Excel, save the workbook to OneDrive or SharePoint and use the Share button so multiple people can co-author online. Turn on Track Changes or use version history so you can roll back if something breaks. Define clear ownership: one person is the budget owner who approves structural changes; others can add actuals or notes. Finally, bake a review ritual into your calendar: for example, a 30-minute monthly budget review where you screen-share the sheet, discuss major variances, and capture decisions immediately in the file so it stays the single source of truth.
An AI agent, like one built on Simular Pro, can act as your behind-the-scenes finance ops assistant. Instead of you logging into Stripe, your bank, your ad platforms, and your CRM, the agent can follow a scripted routine: open each system, export the latest transaction or spend reports, clean the files, and load them into your Google Sheets or Excel budget template. It can then refresh pivot tables, recalculate variances, and even draft a short summary of key changes. Because Simular agents operate on your actual desktop and browser, they work even when tools do not have clean APIs. You remain in control by reviewing the agent’s transparent execution log: every click, paste, and formula update is visible and editable. Over time, you tune the workflow once and reuse it across multiple clients or business units. The result is that your human team spends less time copying numbers between tabs and more time interpreting what the numbers mean for pricing, hiring, and growth.