Oops! Something went wrong while submitting the form.

.png)
.svg)
Every owner, marketer, and agency lead knows the feeling: ten Google Sheets tabs, each with a slice of the truth—leads in one, ad spend in another, revenue in a third. Manually stitching them together for a weekly report steals an hour you should spend with clients or on strategy.
A pivot table built from multiple sheets turns that chaos into a single, trustworthy dashboard. By standardizing headers and consolidating raw tables into one pivot-ready range, you can slice performance by channel, campaign, or rep in seconds instead of minutes.
Now imagine delegating all of that prep to an AI computer agent. Instead of you hunting through tabs, a Simular agent opens Google Sheets, pulls in each source sheet, updates the QUERY range, refreshes the pivot, and even exports a clean summary. While it clicks, types, and checks totals with production-grade reliability, you simply open the finished view and decide what to do next.
If you’re a business owner, marketer, or agency lead, your reality probably looks like this: campaign results in one Google Sheets tab, CRM exports in another, product data in a third. Every week you wrestle them into a single pivot table to answer basic questions like “Which campaign drove the most pipeline by region?”
In this guide, we’ll walk through:
Throughout, refer to Google’s official docs:
This is the simplest and most brittle approach, but great to understand the basics.
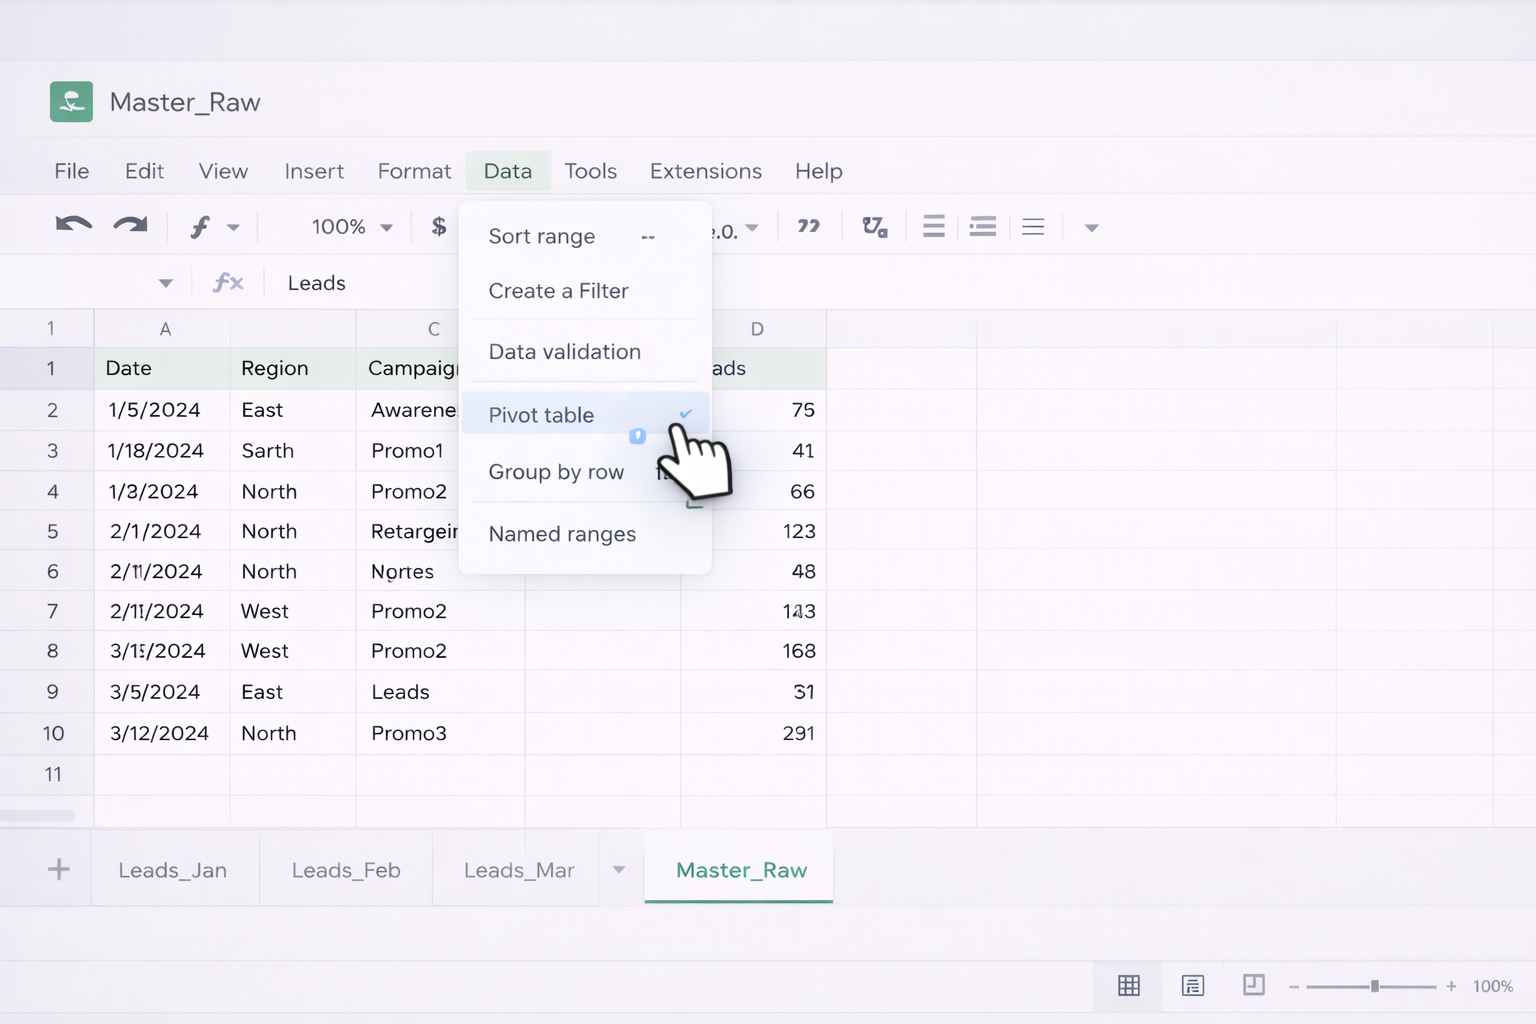
Steps:
Master_Raw.Leads_Jan, Leads_Feb), select the entire data range, including headers.Master_Raw!A1.Master_Raw.Campaign or Region).Amount as SUM, Leads as COUNTA).
Pros:
Cons:
Instead of copy‑pasting, you can combine multiple sheets with a single formula.
Steps:
Combined.A1, enter something like:={Leads_Jan!A1:F; Leads_Feb!A2:F; Leads_Mar!A2:F}A1:F).A2:F).Combined sheet updates automatically.Combined and choose Data → Pivot table.
Pros:
Cons:
QUERY gives you SQL‑like control and is ideal when you want to filter or reshape while merging.
Steps:
Combined_Query sheet, use:=QUERY({Leads_Jan!A2:F; Leads_Feb!A2:F; Leads_Mar!A2:F},"SELECT * WHERE Col1 IS NOT NULL",1)Combined_Query:Campaign or Source.Month or Region.For more on QUERY, see Google’s help center: https://support.google.com/docs/answer/3093343
Pros:
Cons:
When your source data lives in different files, not just tabs, use IMPORTRANGE.
Steps:
Combined_Import, use:={IMPORTRANGE("spreadsheet_url_1","Leads_Jan!A2:F"); IMPORTRANGE("spreadsheet_url_2","Leads_Feb!A2:F")}Combined_Import.
Pros:
Cons:
For pivot basics again, see: https://support.google.com/docs/answer/1272900
Manual work breaks down when:
Here’s where no‑code tools shine.
Add‑ons like Coefficient can pull data from CRMs, ad platforms, and databases into Google Sheets on a schedule, ready for pivoting.
Workflow:
Raw_CRM.
Pros:
Cons:
You can route events (form submissions, CRM updates, ecommerce orders) directly into Sheets.
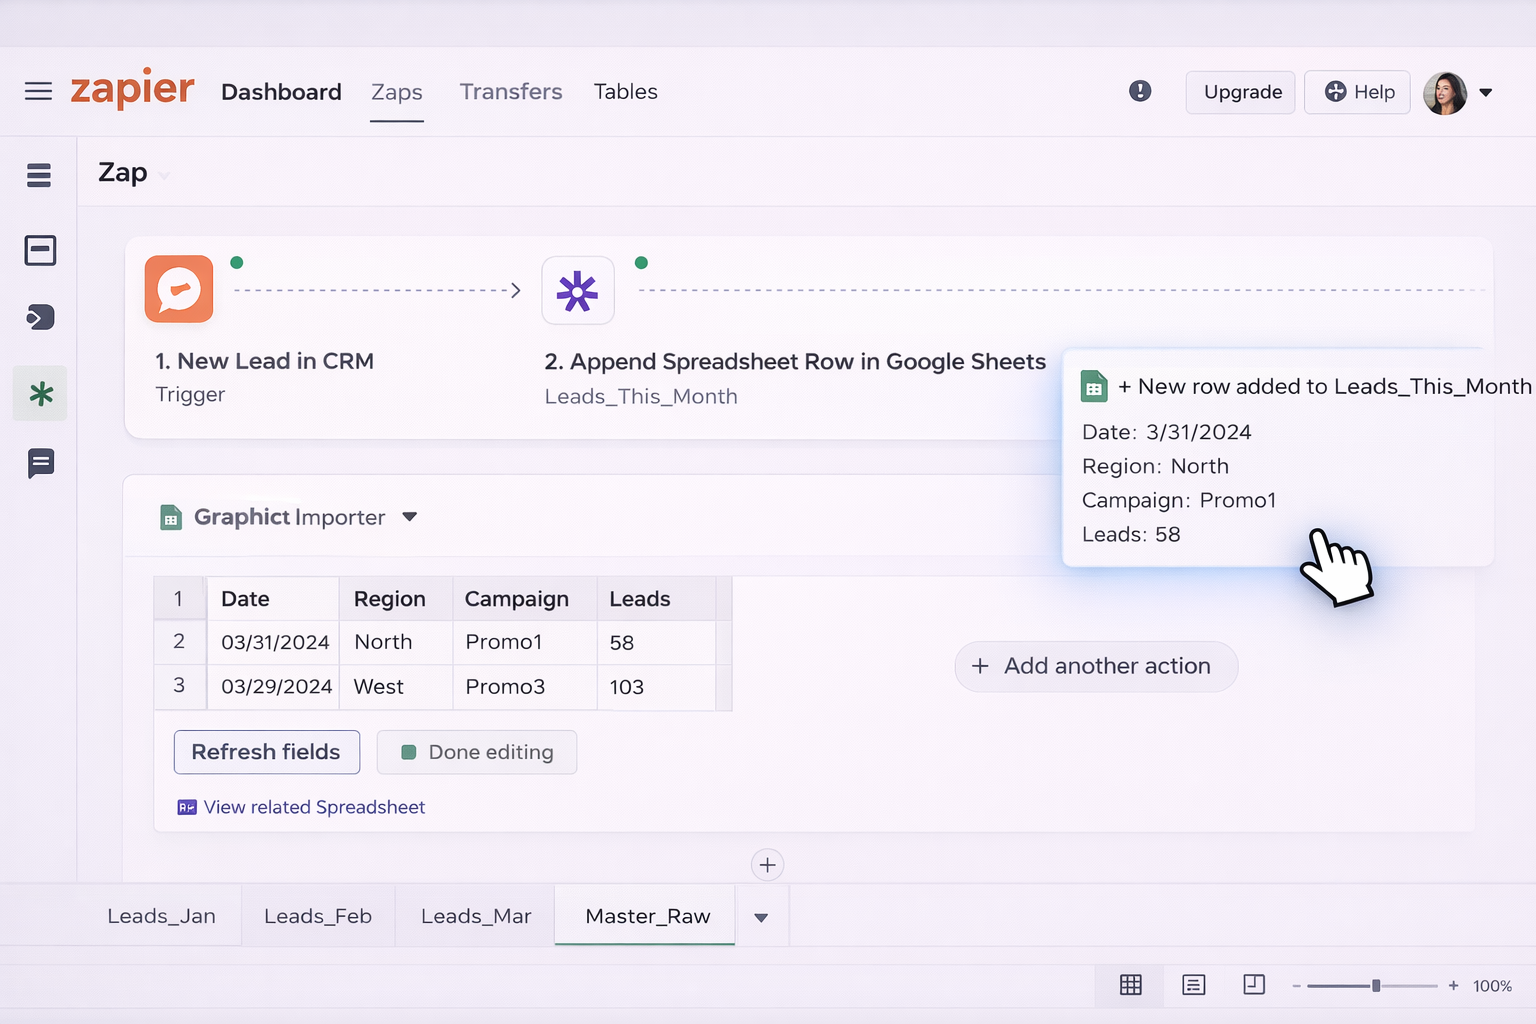
Workflow example for an agency:
Leads_This_Month in Google Sheets.Combined or Combined_Query sheet to merge monthly tabs.
Pros:
Cons:
At some point, even no‑code tools fall short. You want:
Simular’s AI computer agents are built exactly for this: they operate your desktop and browser as a power assistant, but with production‑grade robustness.
Scenario: A marketing agency reports performance across 20 clients.
What the Simular agent does:
Combined_Query sheet, checks that the QUERY formulas are intact, and corrects obvious errors.
Pros:
Cons:
Learn more about Sai’s capabilities: https://www.sai.work/
Scenario: You onboard new clients every week and need identical but separate reporting.
Workflow:
ClientName = X).
Pros:
Cons:
With Simular’s neuro‑symbolic approach, you get the flexibility of LLMs with the precision of deterministic flows, which is exactly what fragile spreadsheet processes need. Instead of worrying that one broken formula will ruin your Monday, you let a repeatable AI agent build, refresh, and audit your Google Sheets pivot tables from multiple sheets—while you focus on winning the next deal.