Oops! Something went wrong while submitting the form.
How to Build Annual Reports in Google Sheets & Excel
Build a clean annual expense report in Google Sheets or Excel while an AI computer agent collects transactions, cleans data, and keeps totals audit‑ready.
An annual expense report is your financial year, distilled into one clear story. It shows where every travel, ad, SaaS, and coffee dollar really went, so you can price offers confidently, trim waste, and walk into investor or tax conversations without guessing. For agencies and fast‑moving teams, it also becomes a shared source of truth that keeps client budgets honest and internal spend aligned with strategy.
This is exactly where an AI computer agent shines: it can sweep through cards, bank feeds, Google Sheets, and Excel files, categorize line items, attach receipts, and reconcile totals automatically, so your team only reviews exceptions instead of wrestling with raw data.
How to Build Annual Reports in Google Sheets & Excel
Picture the last week of your fiscal year. Receipts are buried in inboxes, cards are maxed from Q4 campaigns, and someone says, ‘We need the annual expense report by Friday.’ The good news: you can absolutely tame this—first manually, then at scale with an AI agent.
Way 1: Manual Annual Expense Report in Google Sheets
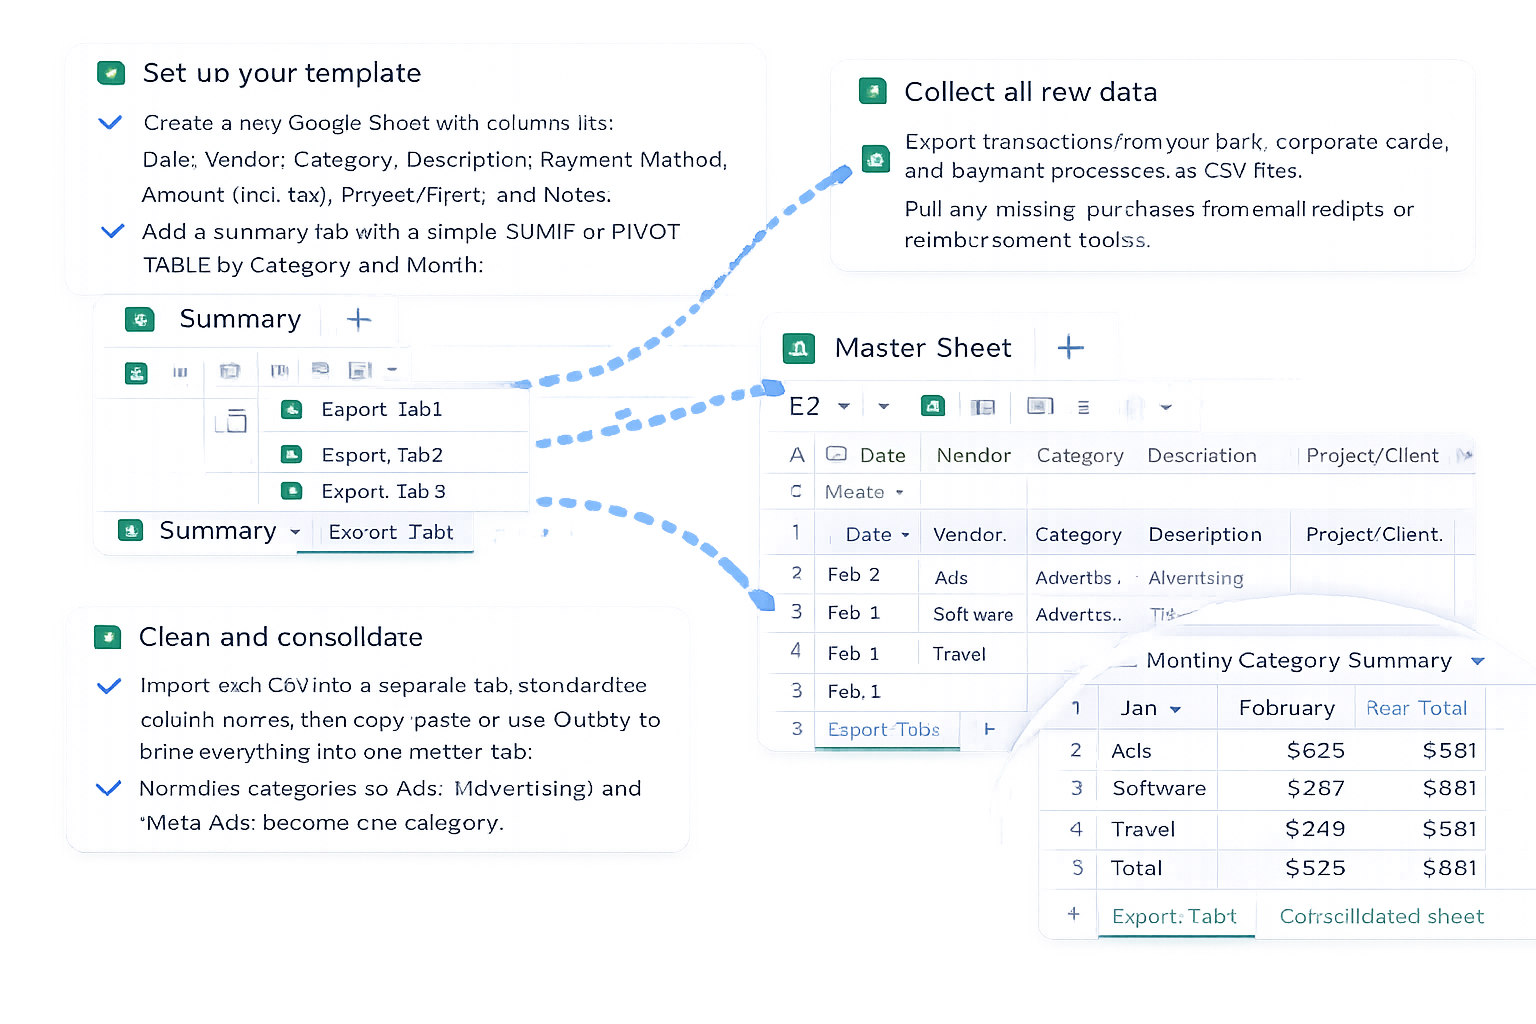
Set up your template Create a new Google Sheet with columns like: Date, Vendor, Category, Description, Payment Method, Amount (incl. tax), Project/Client, and Notes. Add a summary tab with a simple SUMIF or PIVOT TABLE by Category and Month.
Collect all raw data Export transactions from your bank, corporate cards, and payment processors as CSV files. Pull any missing purchases from email receipts or reimbursement tools.
Clean and consolidate Import each CSV into a separate tab, standardize column names, then copy/paste or use QUERY to bring everything into one master tab. Normalize categories so 'Ads', 'Advertising', and 'Meta Ads' become one category.
Reconcile and review Compare the total spend in your master sheet with bank statements. Spot‑check big or unusual items. Add filters so your team can slice by client, campaign, or department.
Pros: Free, flexible, collaborative, great for small teams. Cons: Time‑consuming, error‑prone, and hard to repeat consistently year after year.
Way 2: Manual Annual Expense Report in Excel
Use an annual template Start from an annual or monthly‑to‑annual Excel template. Include separate tabs for each month and a Year Summary tab that rolls everything up with formulas.
Import data and map columns Use Excel’s Text/CSV import to bring in bank and card exports. Map fields (date, description, amount) into a standard layout. Use Data Validation to enforce consistent categories.
Analyze with PivotTables Build PivotTables to see spend by Category, Department, and Month. Add slicers for quick, CFO‑friendly views.
Lock the structure Once the layout is stable, protect formula cells to prevent accidental edits. Save a fresh copy for each year.
Pros: Powerful analysis, familiar to finance teams, excellent for board‑ready summaries. Cons: Files get heavy, collaboration is clunky, and updates are still mostly manual.
Way 3: Semi‑Automated With Formulas and Templates
Before bringing in an AI agent, squeeze more efficiency out of spreadsheets:
Standardized chart of accounts: Reuse the same category list every year so reporting is comparable.
Reference tables: Use VLOOKUP/XLOOKUP or INDEX/MATCH to auto‑map raw descriptions to categories (e.g., any description containing 'META' → Advertising).
Recurring report views: Save common filters and PivotTable layouts, so each year you only swap in new data.
This makes your process faster—but you still have a human copying files, cleaning edge cases, and chasing missing receipts.
Way 4: Fully Automated With a Simular AI Computer Agent
Now imagine handing the whole workflow to an AI agent that can actually use your computer, not just your data.
With Simular Pro, you can:
Connect all the sources The agent logs into bank portals, card dashboards, and accounting tools in your browser, downloads CSVs or Excel files, and saves them into a structured folder system.
Update Google Sheets and Excel automatically The agent opens your existing Google Sheets or Excel templates, imports fresh transaction files, applies your mapping logic, refreshes PivotTables, and updates annual summary tabs—step by step, like a reliable teammate.
Apply your business rules Because Simular agents combine language understanding with symbolic logic, you can encode rules like: 'Tag any Uber after 8 pm as Client Travel' or 'Split Meta invoices 60% Brand, 40% Performance.' The agent then applies these rules consistently across thousands of rows.
Generate review‑ready outputs Finally, the agent exports polished PDFs, summary decks, or CSVs for your accountant, investors, or clients, and can even email or upload them where you need.
Pros: Massive time savings, consistent categorization, production‑grade reliability for workflows with thousands of steps, and transparent execution—you can see every click and formula change the agent makes. Cons: Requires some upfront setup and a short training period so the agent learns your templates and rules.
Putting It All Together
A smart path is:
Start with a solid manual template in Google Sheets or Excel.
Add formulas and PivotTables to make analysis repeatable.
Then let a Simular AI computer agent take over the grunt work: downloading data, cleaning it, updating sheets, and assembling your annual expense story—so you stay focused on pricing, strategy, and growth instead of cell B247.
How to Scale Annual Expense Reports with AI Agent
Train Simular Agent
Train your Simular AI agent by walking it through your existing Google Sheets or Excel templates, sample receipts, and chart of accounts so it learns how you categorize and roll up yearly spend.
Test & Refine Agent
Use Simular Pro to run small test reports on a few months of data first, comparing its Google Sheets or Excel outputs to your manual version, then refine prompts and rules until results match.
Delegate at Scale
Once you trust it, delegate the full annual expense workflow to your Simular AI agent: pulling data, updating Google Sheets or Excel, refreshing pivots, and exporting summaries for reviews.
Learn how to automate Google Sheets
Google Sheets makes it easy to log, categorize, and visualize yearly spend in one shared sheet, with filters and charts for fast, accurate reviews.


.svg)