How to Build a Google Sheets Win-Loss Dashboard Guide

Build a win loss analysis dashboard in Google Sheets powered by Salesforce data and an AI computer agent that keeps metrics fresh, narratives clear, and teams aligned.
Advanced computer use agent
Production-grade reliability
Transparent Execution

Why Google Sheets + Salesforce

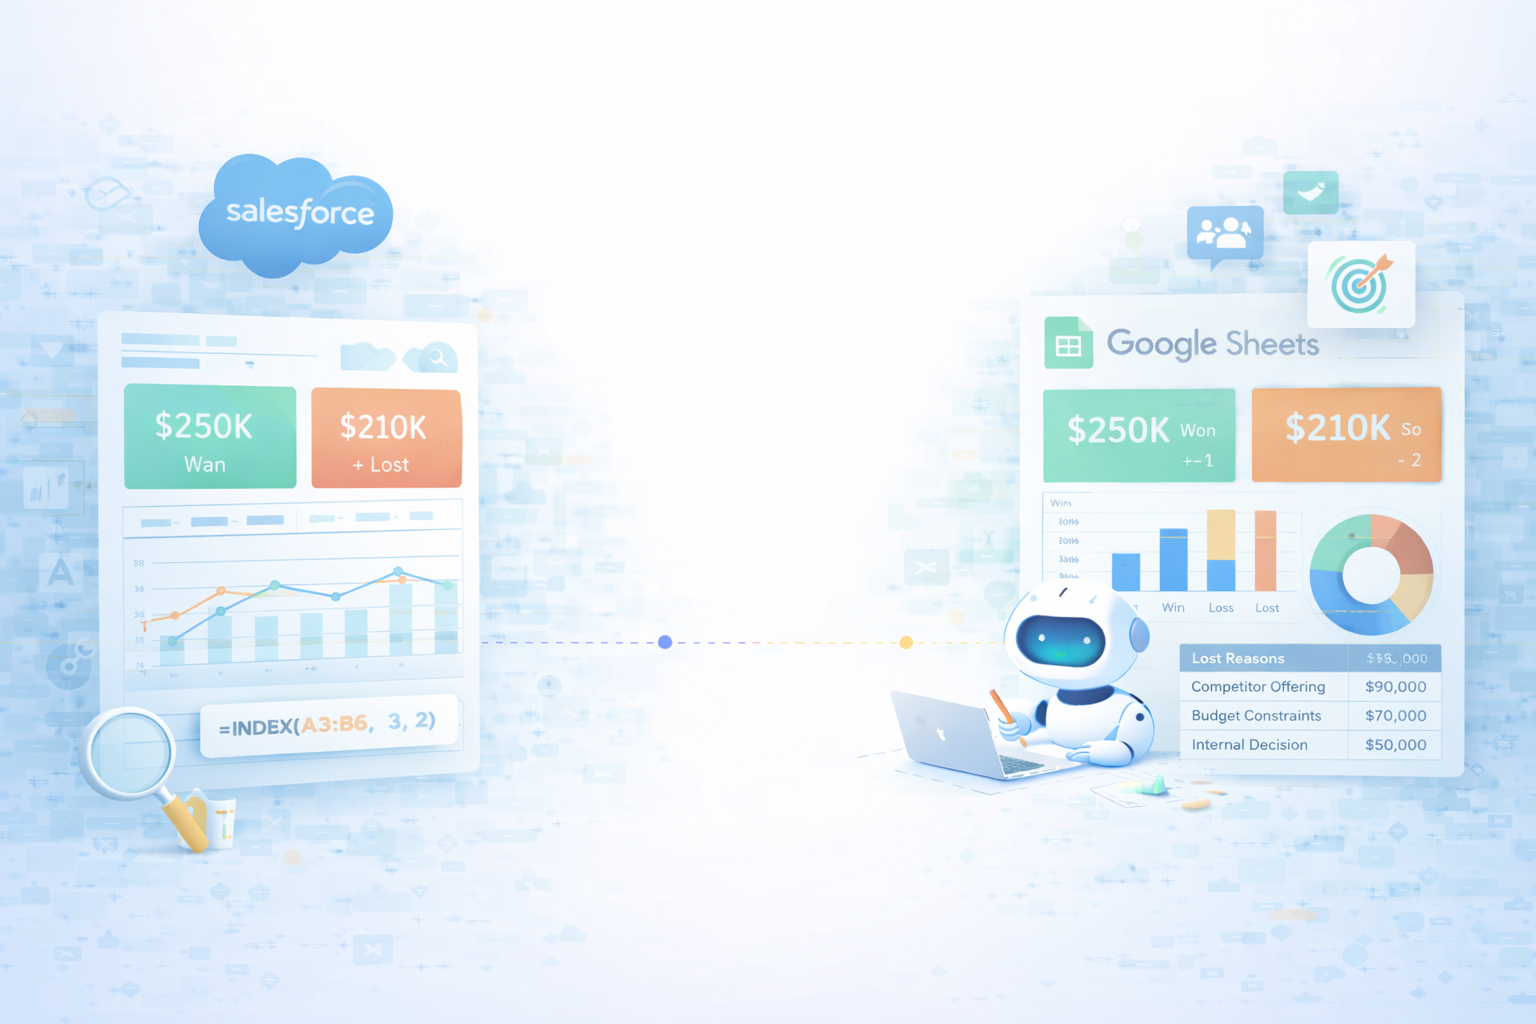
Every sales leader has felt that sinking feeling in QBRs: a wall of anecdotes, a few scattered reports, and no shared answer to the simple question, 'Why did we win or lose?' A win loss analysis dashboard cuts through the noise. By piping opportunity data from Salesforce into Google Sheets, you see win rates by rep, segment, and channel, spot failing playbooks early, and double down on the motions that actually close revenue.In Sheets you can blend Salesforce with marketing and finance data, test hypotheses in minutes, and share an interactive dashboard that anyone can filter. Instead of debating opinions, your team rallies around visible patterns: which industries convert, which competitors beat you, which stages leak.Now add an AI computer agent on top. Instead of someone burning hours every week exporting reports, cleaning columns, refreshing charts, and writing commentary, the agent handles the entire loop: logging into Salesforce, updating Google Sheets, recalculating metrics, and even drafting a narrative summary. You get the same rigor of a RevOps analyst, on autopilot, at a cadence you’d never sustain manually.

How to Build a Google Sheets Win-Loss Dashboard Guide

Here’s how to build and scale a win loss analysis dashboard in Google Sheets, from scrappy manual setups to fully automated AI-agent workflows.### 1. Manual, traditional ways**Method 1: Export from Salesforce, analyze in Google Sheets**1) In Salesforce, open the Opportunities tab and create a report that includes fields like Stage, Amount, Close Date, Owner, Type, Lead Source, Industry, and a Closed Won/Closed Lost indicator. Salesforce’s report builder overview is here: https://help.salesforce.com/s/articleView?id=sf.reports_builder_overview.htm&type=5.2) Filter the report to a meaningful timeframe (e.g., last quarter) and run it.3) Export the report as CSV.4) In Google Sheets, create a new spreadsheet and use `File > Import` to upload the CSV. Docs on importing data: https://support.google.com/docs/answer/40608.5) Clean your data: normalize stage names, ensure Closed Won/Closed Lost values are consistent, and check for missing amounts.6) Add calculated columns, e.g.: - Win flag: `=IF(Stage="Closed Won",1,0)` - Loss flag: `=IF(Stage="Closed Lost",1,0)`7) Create summary metrics using functions like `COUNTIF`, `SUMIF`, and `AVERAGEIF` to calculate win rate, average deal size, and average sales cycle.8) Build charts and pivot tables via `Insert > Chart` and `Insert > Pivot table` to visualize win rate by rep, industry, and lead source (chart help: https://support.google.com/docs/answer/3093480; pivots: https://support.google.com/docs/answer/1272900).*Pros:* Total control, deep familiarity with your data, zero extra tools. *Cons:* Time-intensive, easy to introduce human error, hard to keep updated.**Method 2: Quarterly 'post-mortem' review**1) Once a quarter, repeat the export process but focus only on Closed Lost deals.2) In Sheets, filter to high-value or strategic losses.3) Add columns for 'Primary loss reason', 'Competitor', and 'What we’d change next time'.4) Sit with sales leaders and manually tag each loss while memories are fresh.5) Use pivot tables to see which reasons and competitors dominate.*Pros:* Rich qualitative insight, great for strategic shifts. *Cons:* Episodic, backward-looking, and reliant on people’s memory.**Method 3: Rep-owned tracking sheet**1) Create a shared Google Sheet where each rep logs key details after every major win or loss.2) Freeze header rows and protect structure so reps only fill in specific columns (see protected ranges: https://support.google.com/docs/answer/1218656).3) Once a week, use filter views (https://support.google.com/docs/answer/3540681) to review new entries, calculate rolling win rates, and spot coaching needs.*Pros:* Lightweight, encourages reflection, no Salesforce admin changes. *Cons:* Data is incomplete, dependent on rep discipline, and can drift from CRM reality.### 2. No-code automation methods**Method 4: Scheduled Salesforce-to-Sheets sync with add-ons**Tools like Coupler.io or Coefficient connect Salesforce and Google Sheets without code. The pattern is similar:1) Install the chosen add-on from the Google Workspace Marketplace into your Sheets.2) Authenticate your Salesforce account inside the add-on.3) Select the Opportunity object and choose fields that match the manual methods above.4) Point the add-on to a specific Sheet tab and set a refresh schedule (e.g., hourly or daily).5) Build pivot tables and charts on top of that raw data tab. Because the underlying data keeps refreshing, your dashboard stays live.You still use native Sheets features – formulas, charts, filter views – but skip the export/import dance.*Pros:* Always-fresh data, no CSVs, minimal maintenance, great for RevOps. *Cons:* Another tool to manage and pay for; customization is limited to what the add-on exposes.**Method 5: No-code alerts and workflows around your dashboard**1) Use Google Apps Script or a no-code tool like Zapier/Make to monitor your dashboard’s summary cells.2) For example, trigger a Slack or email alert when win rate drops below a threshold or a specific competitor appears in more than N losses.3) In Sheets, centralize key metrics in a 'KPIs' tab, so your automation only has to read a few cells.4) Use Apps Script (https://developers.google.com/apps-script/guides/sheets) to run checks on a time-driven trigger and send outbound messages.*Pros:* Fast feedback loops, proactive pipeline management. *Cons:* Still requires someone to design and maintain the logic; scripts can silently break.### 3. Scaling with AI agents (Simular) at desktop levelOnce you’ve proven the value of your win loss dashboard, the painful part becomes the busywork: logging into Salesforce, sanity-checking fields, refreshing Sheets, and narrating the story for stakeholders. This is exactly where an AI computer-use agent like Simular Pro shines.**Method 6: Agent as your RevOps assistant**1) Configure a Simular Pro agent with access to your browser and desktop.2) Give it a written playbook: navigate to Salesforce, open a saved Opportunities report, apply date filters, export CSV.3) Have the agent open Google Sheets, import the file into a 'Raw_Opportunities' tab, and run any required clean-up steps (e.g., standardizing stage names, checking for missing amounts) using built-in Sheets menus and formulas.4) Instruct the agent to refresh pivot tables and charts, then copy updated summary metrics into a 'KPI_Snapshot' tab.5) Finally, ask it to generate a short written summary in a 'Narrative' tab: key win rate movements, biggest shifts by segment, and standout reps.*Pros:* Offloads the entire mechanical workflow, leverages your existing Salesforce reports and Google Sheets model, no APIs required – it behaves like a human ops analyst. *Cons:* Requires a clearly documented workflow; first-time setup and testing take some care.**Method 7: Agent-driven storytelling and distribution**1) After updating the dashboard, have the Simular agent capture screenshots of key charts.2) In a browser, ask it to open your email or Slack client.3) The agent drafts a weekly 'win/loss briefing' for leadership, attaches screenshots, links to the live Sheet, and highlights 3–5 actions for sales and marketing.4) On a schedule (via Simular’s webhook integration into your existing pipelines), trigger this workflow every Monday morning.*Pros:* Turns raw dashboards into consistent executive communication, keeps everyone aligned without meetings. *Cons:* You must review tone and messaging at first; governance around who receives what is important.The pattern is simple: start with a solid manual Google Sheets + Salesforce win loss dashboard, add no-code sync to keep it live, and then let an AI agent like Simular handle the tedious, cross-app execution at scale while you focus on strategy.

Scale Win-Loss Dashboards with AI Agents in Sheets

Onboard Simular agent
Install Simular Pro, record a clear workflow for pulling Salesforce opportunity reports and updating your Google Sheets win loss dashboard, then save it as a reusable agent playbook.
Test and refine agent
Run the Simular AI agent on a small Salesforce date range first, watch every Google Sheets action in its transparent execution log, then tweak steps until the dashboard updates perfectly.
Delegate and scale tasks
Hook Simular’s agent into your existing schedules or webhooks so it refreshes Salesforce data, updates Google Sheets, and publishes win loss summaries automatically across teams.

FAQS