Oops! Something went wrong while submitting the form.
How to Create Mind Maps and Flowcharts with AI: Automated Diagram Generation from Any Text
Paste any text. Get a mind map in 30 seconds. This step-by-step guide shows you how to turn meeting notes, articles, and brainstorms into professional diagrams -- automatically. No Figma. No Miro. No manual work. Try the free workflow inside.
Why Does Creating Mind Maps and Flowcharts Still Take So Long?
Source Document Parsing
Sai reads any file on your desktop -- PDFs, DOCX, meeting transcripts, browser tabs, spreadsheets -- and extracts the key concepts and relationships needed to build a structured mind map, eliminating the manual "read and summarize" step entirely.
Excalidraw Diagram Generation
Using its built-in excalidraw-diagram-generator skill, Sai converts natural language descriptions into .excalidraw JSON files that produce editable flowcharts, mind maps, relationship diagrams, and system architecture visuals you can open in Excalidraw.
End-to-End Workflow Automation
Sai does not stop at diagram creation. It can take the finished mind map and insert it into a Google Doc, embed it in an HTML slide deck, or export it as a PDF -- turning a raw text dump into a polished, shareable visual in a single workflow.
Why Does Creating Mind Maps and Flowcharts Still Take So Long?
The global mind mapping software marketis valued at $9.39 billion in 2025 and is expanding at a CAGR of 6.25% through 2033 (Cognitive Market Research, 2025). Clearly, demand for visual thinking tools is enormous. Yet most professionals still build diagrams manually. Here is why:
Reading and extraction is the bottleneck. The actual drawing takes minutes. The hard part is reading a 20-page document, identifying the 15 key concepts, and deciding how they relate to each other. Most mind mapping software assumes you already know what to draw -- it gives you a blank canvas and leaves the thinking to you.
Tools are siloed from source material. Your meeting notes live in Google Docs. Your research lives in browser tabs. Your data lives in spreadsheets. Existing diagramming tools like Miro and Lucidchart require you to manually copy-paste content in before you can start mapping. The context switch alone adds 10-15 minutes per diagram.
AI features in existing tools are shallow. Tools like Whimsical and Miro have added AI mind map features, but they generate from a single text prompt -- they cannot read a PDF on your desktop, cross-reference it with a spreadsheet, and produce a diagram that synthesizes both. The AI is a feature, not a workflow.
TL;DR -- Mind mapping by the numbers:
The mind mapping software market is projected to reach $9.39 billion in 2025, growing at 6.25% CAGR through 2033 (Cognitive Market Research, 2025)
Manual mind map creation takes 30-60 minutes per diagram for moderately complex topics when accounting for source reading, concept extraction, and layout
The market is expanding at7.34% CAGR through 2035, driven by AI integration and remote collaboration (360 Research Reports, 2025)
Most AI diagramming features only accept a single text prompt -- they cannot parse existing documents, PDFs, or multi-source data
Knowledge workers create an average of 3-5 diagrams per week for project planning, brainstorming, and documentation purposes
What Is AI-Powered Mind Map and Flowchart Generation?
AI-powered diagram generation is the process of using artificial intelligence to automatically extract concepts, identify relationships, and produce structured visual diagrams -- mind maps, flowcharts, or system architecture views -- from raw text input. Unlike traditional mind mapping software where you manually place nodes and draw connections, AI handles the cognitive work of parsing content and determining hierarchy.
The complete workflow involves six stages:
Source ingestion -- Reading raw input: text documents, meeting notes, URLs, PDFs, spreadsheets, or freeform prompts
Concept extraction -- Identifying key topics, subtopics, entities, and action items from the source material
Relationship mapping -- Determining how concepts connect: parent-child hierarchies, sequential flows, causal links, or lateral associations
Diagram type selection -- Choosing the right visual format: mind map for brainstorming, flowchart for processes, tree diagram for hierarchies, or network graph for relationships
Layout generation -- Arranging nodes, edges, and labels into a readable, well-spaced visual layout
Export and editing -- Outputting the diagram in an editable format (.excalidraw, .svg, .png, or embedded in docs/slides) for refinement
How to Create Mind Maps and Flowcharts with AI (Step-by-Step)
Step 1: Gather and Identify Your Source Material
Before generating any diagram, decide what you are mapping. Sai can work from virtually any input type:
A single text prompt: "Create a mind map of digital marketing channels"
A document on your desktop: A 30-page PDF research report, a DOCX project brief, or meeting transcript
A web page: Sai opens the URL in its browser, reads the page content, and extracts the key concepts
Multiple sources simultaneously: Sai reads a Google Sheet of competitor data, cross-references it with three browser tabs of product pages, and synthesizes everything into one unified diagram
This is where Sai differs fundamentally from tools like MindMapAI or Mapify, which only accept pasted text or a URL. Sai operates on your actual desktop environment -- it can open files in your file system, read Google Docs via its native Google integration, and browse the web, all in one session.
Step 2: Describe the Diagram You Want
Tell Sai what kind of diagram to generate and what aspects to focus on. The more specific you are, the better the result. Here is a comparison:
Generic prompt (weak): "Create a mind map about marketing"
Specific prompt (strong): "Create a mind map from the attached Q2 marketing strategy PDF. Focus on the three main campaign pillars, break each into channels (paid, organic, email), and add KPI targets as leaf nodes. Use flowchart format for the campaign execution timeline section."
Sai's excalidraw-diagram-generatorsupports four diagram types: flowcharts, mind maps, relationship diagrams, and system architecture diagrams. You can specify the type directly, or let Sai choose based on the content structure.
Step 3: Let Sai Extract Concepts and Build the Structure
Sai reads your source material, identifies the key concepts, determines their hierarchical relationships, and generates an Excalidraw-compatible JSON file. This step typically takes 30-90 seconds depending on source complexity.
For example, given a 15-page competitive analysis document, Sai might extract:
1 central node (your industry segment)
5 primary branches (one per competitor)
3-4 sub-nodes per competitor (pricing, features, strengths, weaknesses)
Relationship arrows between competitors with overlapping features
The output is a structured .excalidraw file that you can open directly in Excalidraw for editing. Every node is individually movable, every connection is editable, and the entire diagram can be exported to PNG, SVG, or embedded in other documents.
Step 4: Review and Refine the Diagram
Open the generated .excalidraw file in Excalidraw (free, open-source, runs in any browser). From here you can:
Drag nodes to adjust positioning
Add or remove branches
Change colors and styles
Add handwritten annotations
Group related concepts
This human-in-the-loop editing step is critical. AI handles the heavy lifting of extraction and initial layout, but domain expertise drives the final arrangement. The time savings come from starting at 80% complete rather than starting from zero.
Step 5: Export or Integrate into Your Workflow
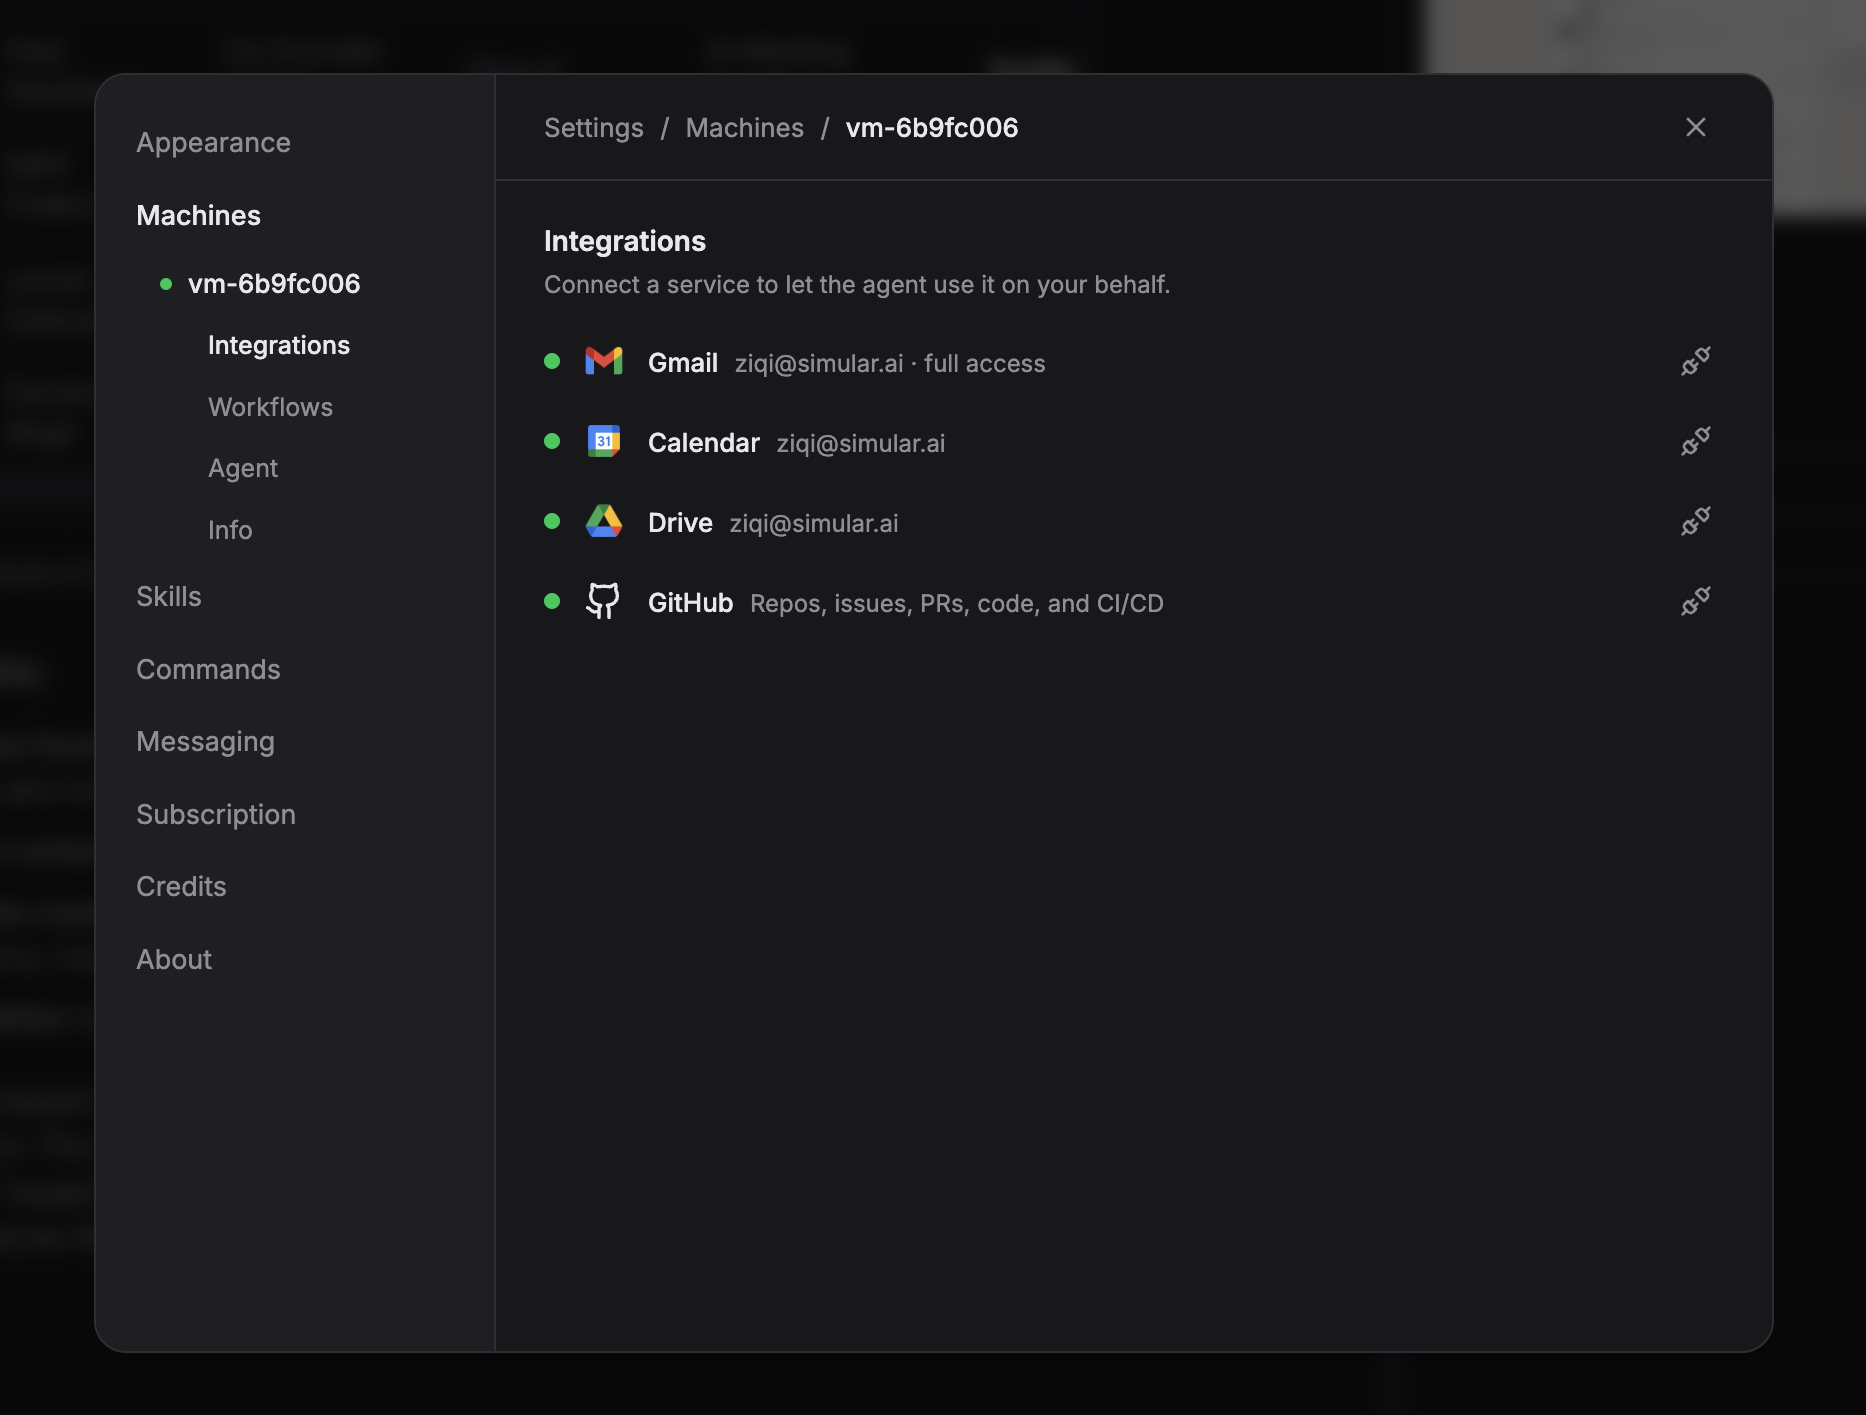
Sai does not stop at diagram generation. Once the mind map or flowchart is ready, you can ask Sai to:
Embed it in a Google Doc using Sai's native Google Drive integration
Insert it into an HTML slide deck using the html-slides skill
Export as PDF for sharing with stakeholders who do not use Excalidraw
Convert diagram concepts into action items in a Google Sheet -- turning a project mind map into a task tracker
This end-to-end capability is what separates a full AI agent approach from standalone diagramming tools. You go from raw document to polished, shared visual without leaving Sai.
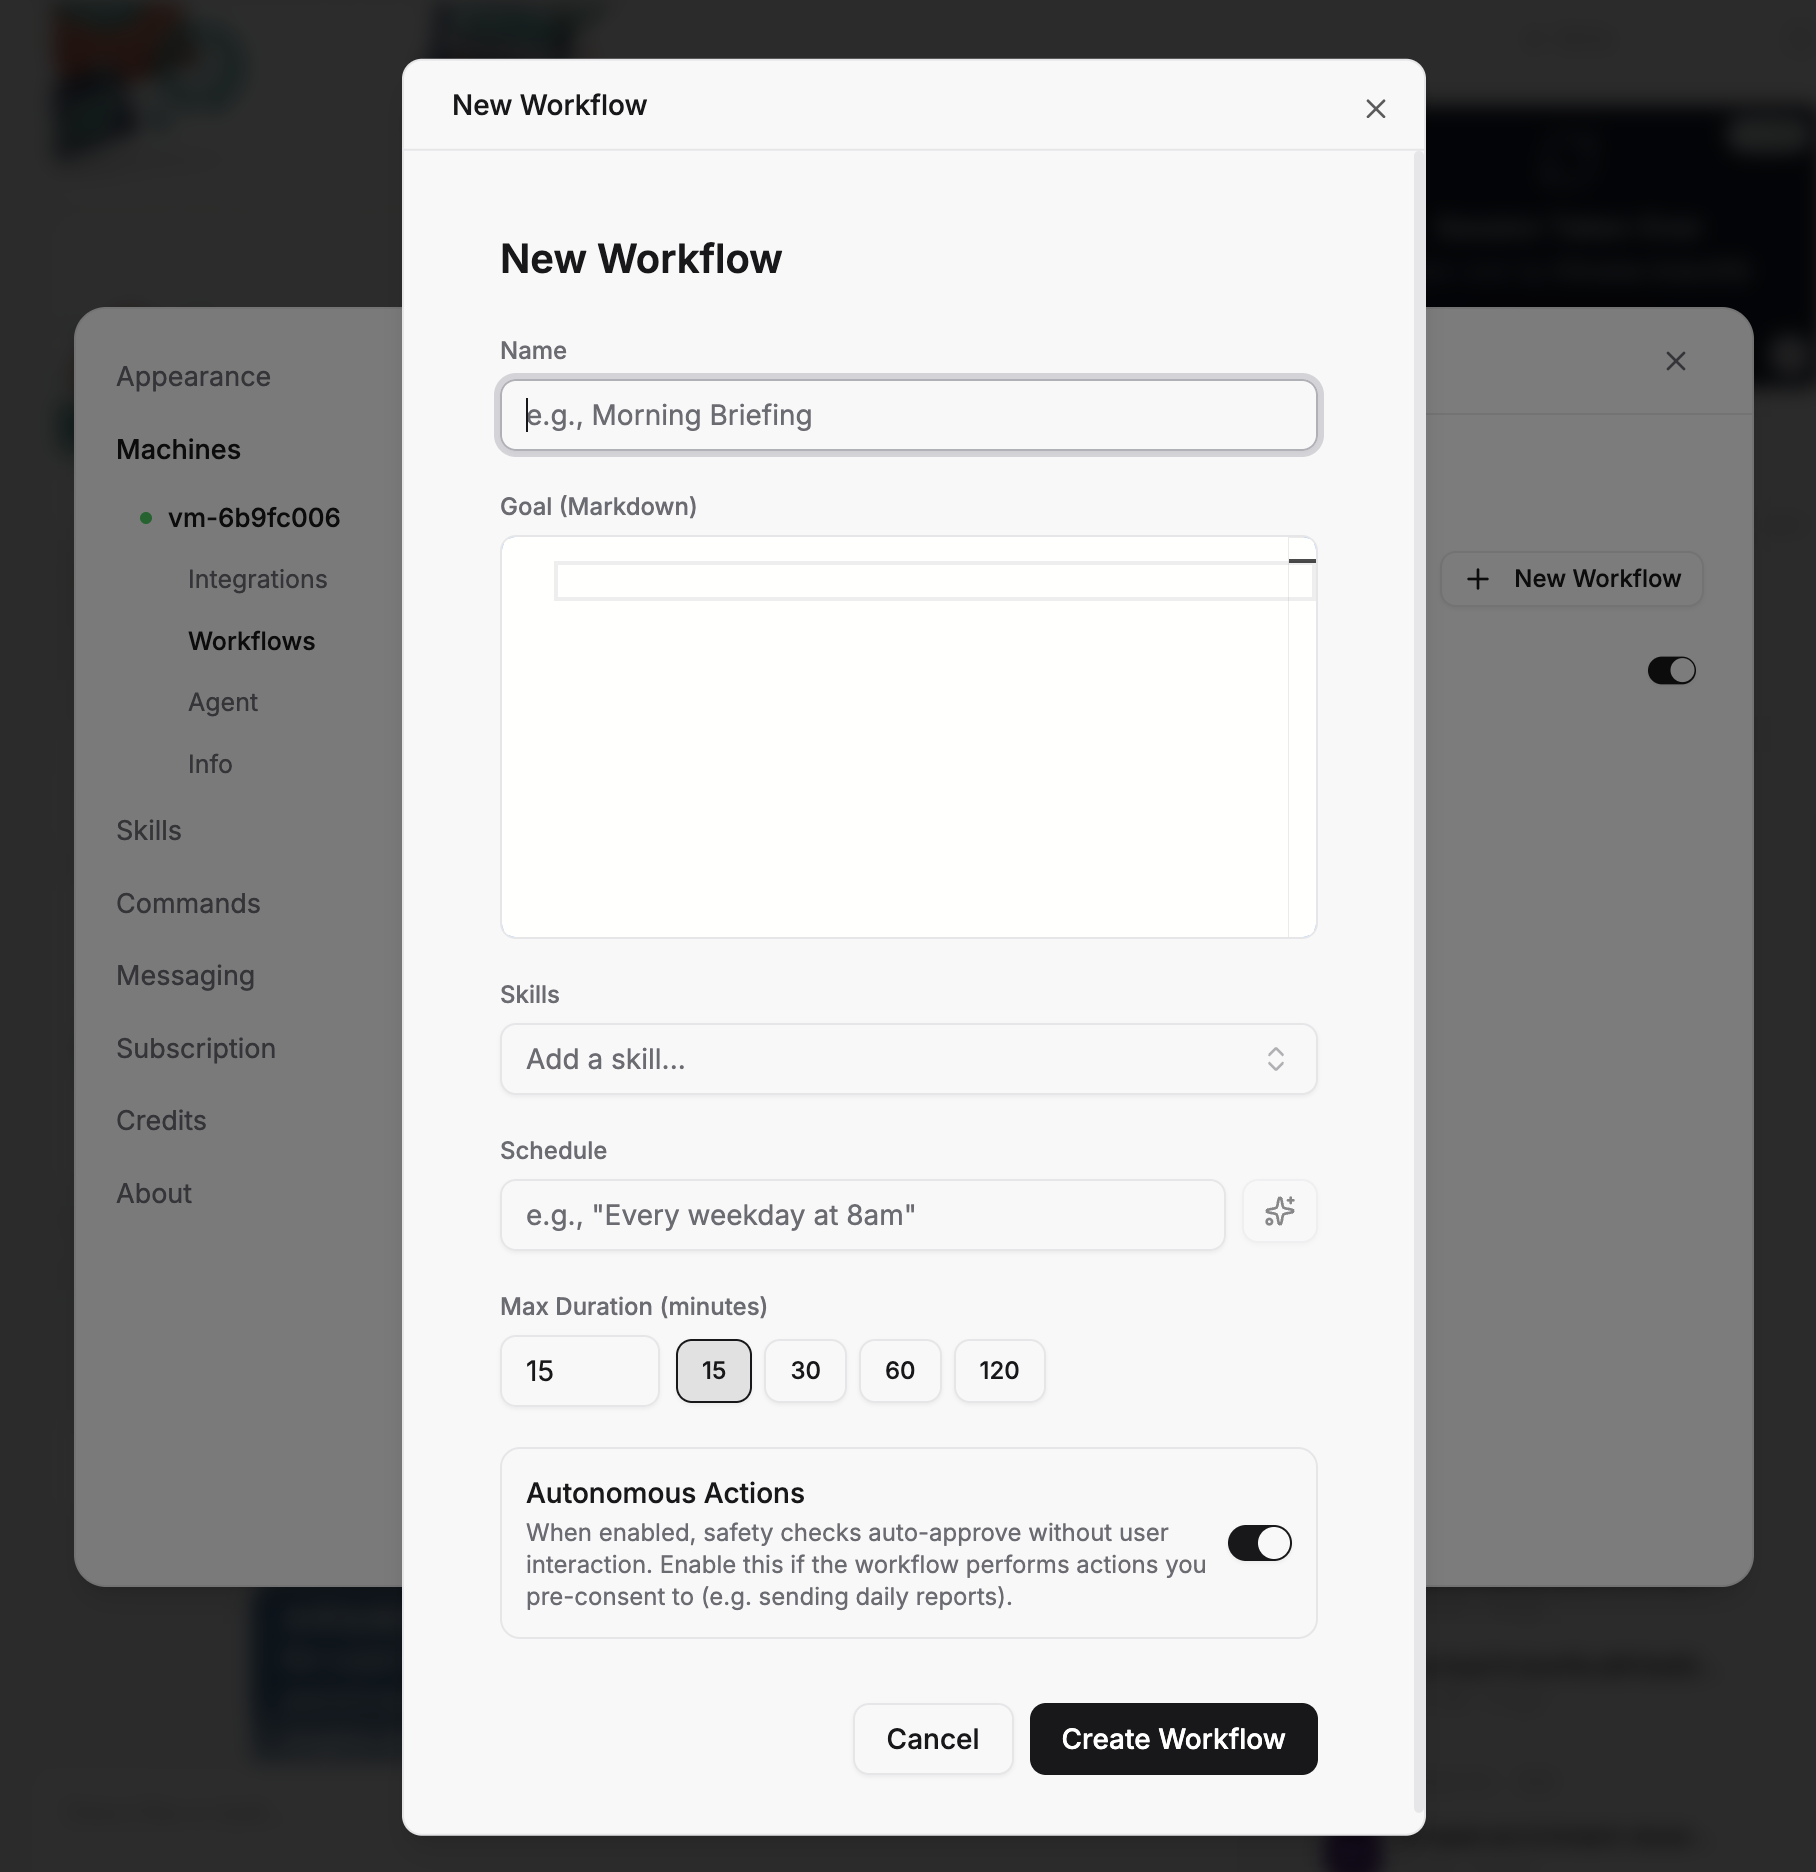
Step 6: Set Up Recurring Diagram Workflows (Optional)
For repeating use cases -- weekly sprint planning mind maps, monthly competitive landscape diagrams, or quarterly strategy visualizations -- Sai supports scheduled workflows. Set a cron trigger so Sai automatically:
Reads the latest data from your Google Sheet or project management tool
Generates an updated diagram reflecting current state
Saves it to your Google Drive or sends it via email
This transforms diagram creation from a manual task into an automated intelligence feed.
Stop doing repetitive tasks. Let Sai handle them for you.
Sai is your AI computer use agent — it operates your apps, automates your workflows, and gets work done while you focus on what matters.

.svg)

.svg)